Stock Analysis · Vishay Precision Group Inc (VPG)
Overview
Vishay Precision Group, Inc. (VPG) designs and manufactures precision sensing, measurement, and control products. In simple terms, its components help customers measure things accurately (like force, weight, pressure, and electrical current) and then use those measurements in industrial systems. These products are typically used in demanding environments where accuracy and reliability matter, such as factory automation, transportation, aerospace and defense, and certain medical or test-and-measurement applications.
VPG’s operations are commonly described through two main business segments in its filings:
- Sensors: Products that measure physical forces and related parameters (for example, load cells, force sensors, and pressure-related sensing solutions), often embedded in industrial systems.
- Weighing Solutions: Equipment and systems used for weighing and measurement in industrial and commercial settings.
The company’s filings also describe a customer base that is largely industrial in nature, which tends to make results sensitive to manufacturing cycles and capital spending.
Main sources of revenue (business mix)
VPG’s revenue is primarily generated from:
- Sensors (typically the larger segment in company reporting)
- Weighing Solutions
Exact segment percentages can change by year and are disclosed in the company’s annual report segment notes.
Over the last several years, total revenue has moved from about $318M (2021) up to about $363M (2022), then down to about $307M (2024–2025). Operating income and net income also contracted materially from their 2022 levels, reflecting the combination of lower revenue and a cost structure that does not shrink as quickly as sales in softer demand periods.
Key Figures
| Metric | Value | Industry ⓘ |
|---|---|---|
| Date | May 18, 2026 | |
| Context | ||
| Sector | Technology | |
| Industry | Scientific & Technical Instruments | |
| Market Cap ⓘ | $1.29B | |
| Beta ⓘ | 1.13 | |
| Fundamental | ||
| P/E Ratio ⓘ | 216.27 | 34.64 |
| Profit Margin ⓘ | 1.85% | 12.84% |
| Revenue Growth ⓘ | 17.60% | 11.80% |
| Debt to Equity ⓘ | 13.26% | 23.13% |
| PEG ⓘ | 5.02 | |
| Free Cash Flow ⓘ | -$1.05M | |
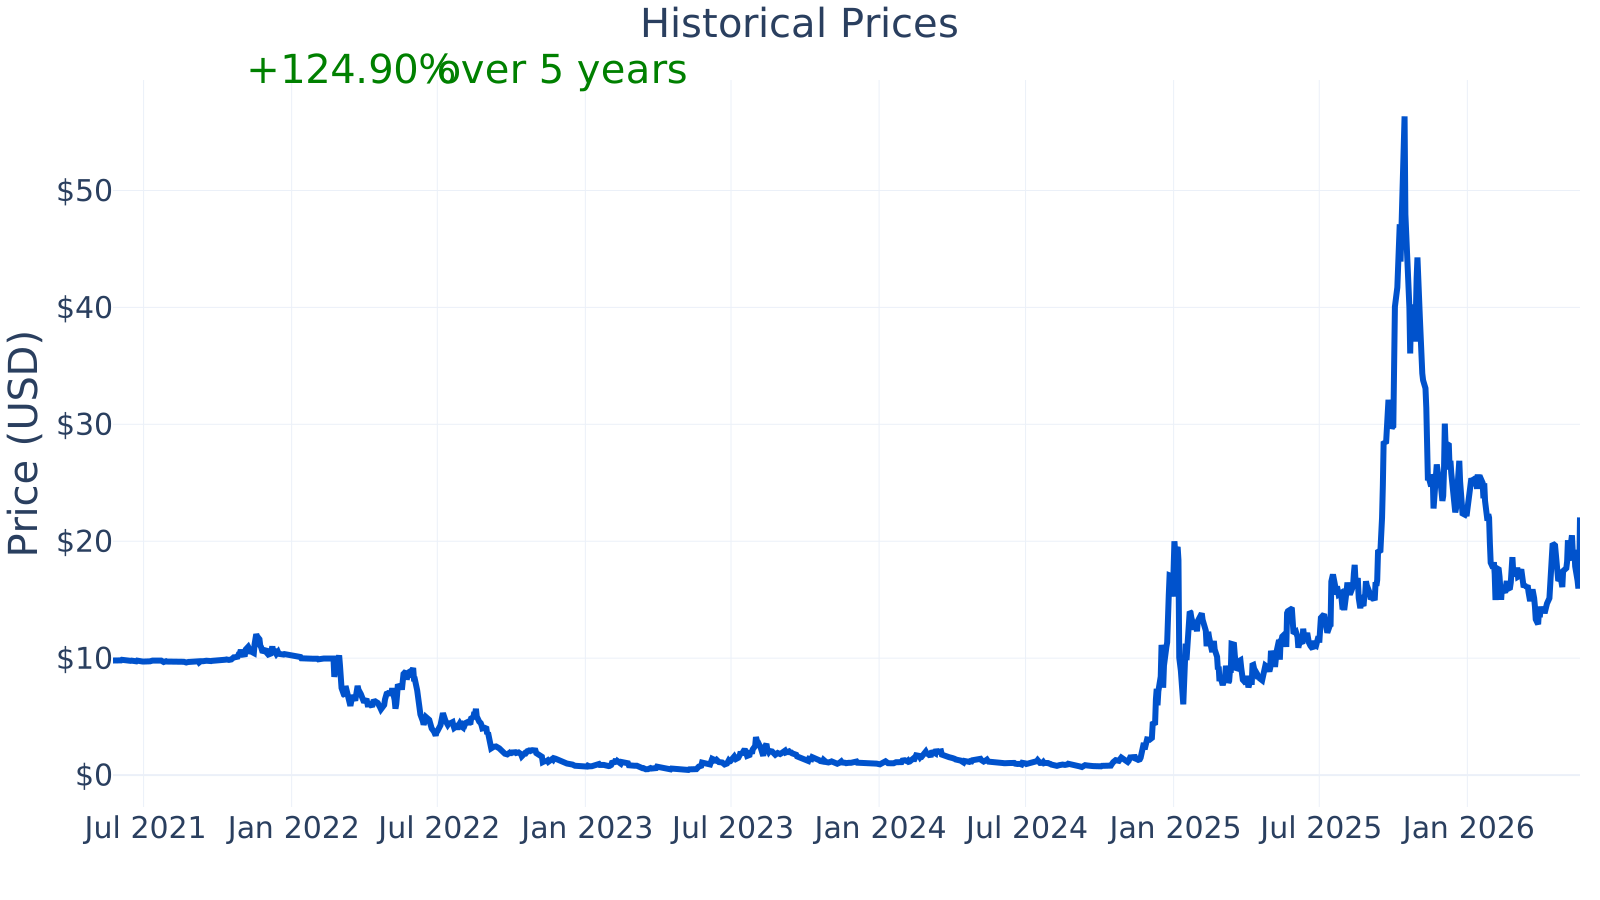
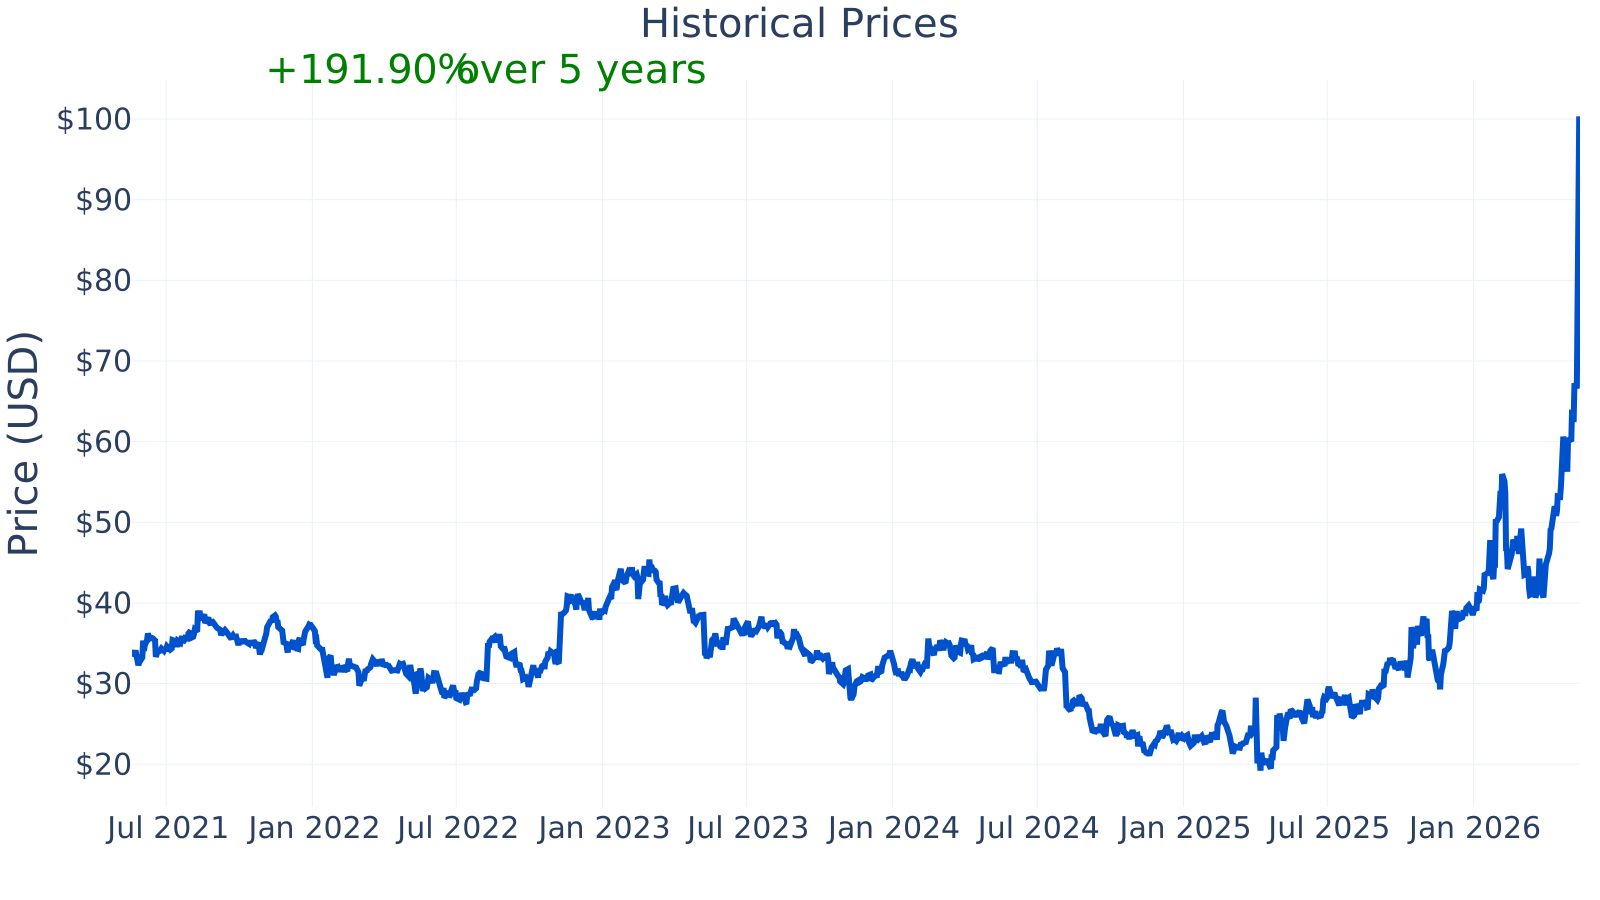
VPG is a mid-cap company (market cap about $1.29B) with a beta of ~1.13, meaning its share price has tended to move somewhat more than the broader market.
On the latest figures shown, year-over-year revenue growth is ~17.6%, which is above the industry median (~11.8%). At the same time, profitability is currently much lower than the industry median: profit margin is ~1.85% versus an industry median of ~12.84%.
Balance-sheet leverage appears comparatively modest: debt-to-equity is ~13.3% versus an industry median of ~23.1%.
Free cash flow over the trailing twelve months is slightly negative (about -$1.0M), which contrasts with the company’s positive free cash flow levels seen in earlier periods on the chart below.
Growth (Medium)
VPG participates in markets linked to long-term themes such as industrial automation, quality control, and the growing need for accurate measurement in advanced manufacturing. In many industries, better sensing and measurement helps reduce waste, improve safety, and increase production consistency—drivers that can persist even as individual end-markets go through cycles.
That said, the company’s recent history suggests a meaningful cyclical component. Revenue growth turned negative through much of 2023–2024 and then improved more recently, which is consistent with industrial demand normalizing after a weaker period.
The year-over-year revenue trend shows a swing from strong growth in 2021–2022, to declines through 2023–2024, and then a return to positive growth most recently (about 17.6%). For long-term context, this pattern suggests VPG’s end markets can cool and re-accelerate rather than delivering steady expansion every year.
A potential catalyst for durable growth would typically come from (1) sustained recovery in industrial demand, (2) successful expansion into higher-value applications (where precision and certification requirements are higher), and (3) maintaining pricing and mix in more specialized product lines. The company discusses these priorities in its annual report narrative and risk factors.
Free cash flow improved into 2024 (peaking around $29.6M on a trailing twelve-month basis) and then weakened sharply, reaching slightly negative most recently (about -$1.0M). For a manufacturing-oriented business, this can happen when profits compress and/or working capital needs rise (for example, changes in inventory and customer receivables), but the key long-term question is whether cash generation returns as margins normalize.
Risks (High)
VPG’s risk profile is influenced by cyclicality and operating leverage. When volumes fall, fixed costs (engineering, facilities, overhead) can pressure profitability. This is visible in the margin trend: profitability has dropped substantially from earlier levels, and it is currently well below the industry median shown.
Profit margin has moved from high single digits in 2022–2023 to much lower levels more recently, with the latest quarter around 1.85%. The industry median shown remains around the low teens, highlighting that VPG’s recent profitability is not only lower than its own prior period but also below many peers in the same broad industry group.
Another major risk is competitive pressure. Precision sensors and weighing systems compete on a mix of performance, reliability, certifications, customer relationships, and total cost. VPG has specialization and an installed base in certain applications, but it faces competition from larger industrial and instrumentation companies as well as focused niche manufacturers. Competitive advantages in this type of business often come from long qualification cycles, customer switching costs in calibrated systems, proprietary know-how, and reputation for accuracy—yet these can be challenged if competitors match performance or undercut pricing.
Supply chain and manufacturing execution also matter. Components and materials availability, quality control, and manufacturing yields can affect delivery performance and costs. In addition, international exposure (customers and operations) can introduce currency and geopolitical risks, which are typically described in detail in the company’s risk factor disclosures.
From a balance-sheet standpoint, debt levels appear moderate and have generally trended down versus earlier periods, with the latest debt-to-equity around 13% (below the industry median shown). Lower leverage can reduce financial stress during weaker cycles, but it does not eliminate earnings volatility when demand softens.
Valuation
On the latest metric table, VPG’s P/E ratio is ~216, far above the industry median shown (~34.6). A very high P/E can sometimes occur when earnings are temporarily depressed (so the “E” in P/E is unusually small), rather than because the stock price is unusually high. This interpretation fits with the low current profit margin shown earlier.
The historical P/E series also shows long periods where VPG traded at P/E levels closer to or below the industry median (for example, mid-teens to 30s in parts of 2022–2024), followed by sharp increases more recently. In practice, this means valuation signals based on earnings are currently harder to interpret than usual because profits have been volatile.
For a long-term assessment, valuation often becomes more meaningful when paired with normalized profitability (for example, comparing valuation against margins and cash generation across a full cycle). With profit margin currently low and free cash flow near breakeven, valuation based on near-term earnings may not reflect mid-cycle economics.
Conclusion
Vishay Precision Group is a specialized precision measurement company serving industrial-oriented markets where accuracy and reliability are important. The business participates in areas connected to long-term industrial automation and measurement needs, but financial results have shown clear cyclicality, with revenue declines in 2023–2024 and a more recent return to positive growth.
The main points to weigh for a long-term view are the contrast between (1) improving recent revenue growth and moderate leverage, and (2) currently weak profitability and soft recent free cash flow. This combination also helps explain why earnings-based valuation measures (like the P/E ratio) look unusually elevated at the moment.
Sources:
- SEC EDGAR — Vishay Precision Group, Inc. filings (Form 10-K, Form 10-Q)
- Vishay Precision Group, Inc. — Investor Relations materials (annual report and SEC filing copies)
- Wikipedia — “Vishay Precision Group” (basic company background)
This article is for informational purposes only and does not constitute financial advice. Some content is AI-generated. See Disclaimer