Stock Analysis · Rackspace Technology Inc (RXT)
Overview
Rackspace Technology, Inc. (RXT) is a technology services company focused on helping organizations run their applications and data across cloud environments. In simple terms, it supports customers that use public cloud providers (such as Amazon Web Services, Microsoft Azure, and Google Cloud) and may also operate legacy or private systems. The company’s work commonly includes cloud migration (moving systems to the cloud), ongoing operations (keeping systems reliable and secure), and professional services (designing and modernizing IT setups).
Its revenue is primarily generated from delivering managed services and professional services tied to cloud and IT operations. In its filings, Rackspace describes revenue by service offerings rather than consumer-style “products,” and the exact mix can change over time. A typical breakdown (as described in company reporting categories) includes:
- Managed services (recurring support/operations for customer environments)
- Professional services (project-based work such as migrations and modernization)
Because the exact percentage split is not included in the information provided here, the list above is descriptive rather than a quantified ranking.
Business profitability context: Over the last several years, the company’s reported revenue has trended downward (from about $3.01B in 2021 to about $2.69B in 2025), while net income has remained negative in each of those years shown, though losses narrowed substantially in 2025 compared with 2022–2024. Interest expense has been a meaningful cost, reflecting the importance of balance-sheet structure for understanding the company.
Across 2021–2025, total revenue declined (about $3.01B to about $2.69B). Gross profit also declined (about $937M to about $360M), which means the “room” left to pay for overhead and interest became smaller. Net losses improved sharply in 2025 versus 2022–2024, but the company still reported a net loss for 2025.
Key Figures
| Metric | Value | Industry ⓘ |
|---|---|---|
| Date | May 18, 2026 | |
| Context | ||
| Sector | Technology | |
| Industry | Software - Infrastructure | |
| Market Cap ⓘ | $1.45B | |
| Beta ⓘ | 2.24 | |
| Fundamental | ||
| P/E Ratio ⓘ | N/A | 30.94 |
| Profit Margin ⓘ | -5.41% | 6.76% |
| Revenue Growth ⓘ | 1.90% | 19.80% |
| Debt to Equity ⓘ | -265.25% | 18.58% |
| PEG ⓘ | 4.93 | |
| Free Cash Flow ⓘ | $76.90M | |
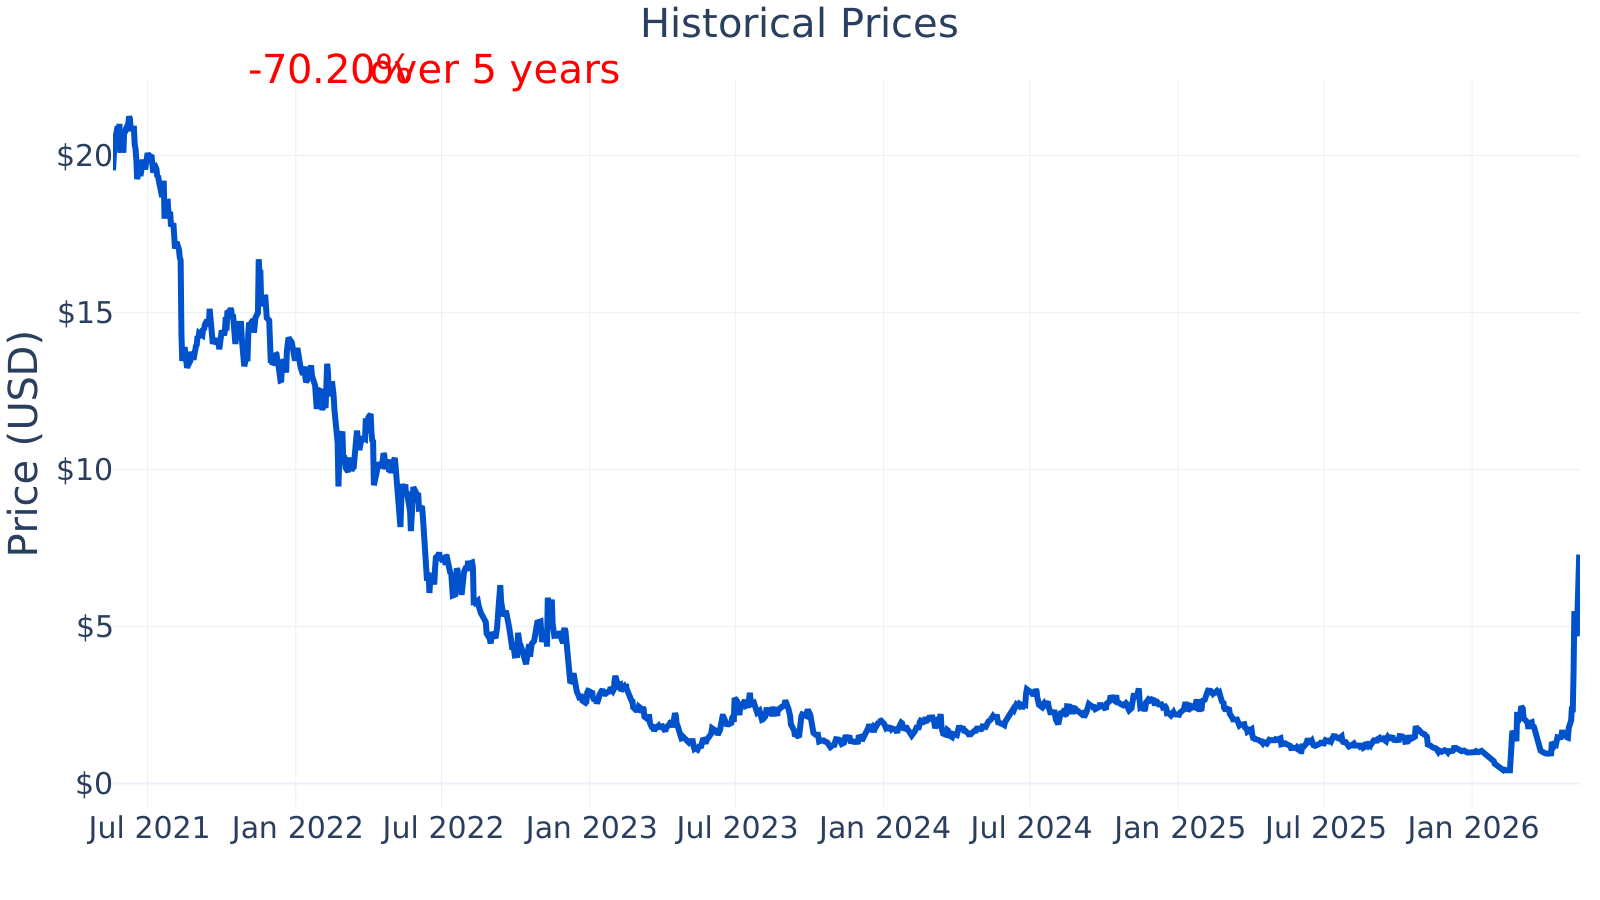
Rackspace Technology’s market capitalization is about $1.45B, placing it in the small-cap range. The stock’s beta of ~2.24 suggests it has historically moved much more than the broader market (higher volatility). Profitability remains a key issue: the latest profit margin shown is about -5.41% versus an industry median near +6.76%. Growth is modest compared with peers: latest year-over-year revenue growth is about +1.91% versus an industry median near +19.8%. Free cash flow over the trailing twelve months is positive at about $76.9M. The P/E ratio is not meaningful here (shown as 0), which typically happens when earnings are negative or otherwise not suitable for a standard P/E comparison.
Growth (Medium)
Rackspace operates in cloud services and IT modernization, a part of the technology sector that is structurally important as organizations continue shifting computing workloads to cloud platforms and increasingly operate in “multi-cloud” setups (using more than one cloud provider). In that sense, the broader category is supported by long-term demand drivers.
However, company-specific growth has been more challenged. The year-over-year revenue growth series shows a long stretch of declines through 2023–2025 before turning slightly positive most recently. This pattern suggests that, while the industry backdrop can be favorable, execution and customer demand for Rackspace’s specific offerings have been uneven.
The chart shows revenue growth slowing from positive rates in 2021–2022 to negative growth through much of 2023–2025, followed by a return to modestly positive growth (about +1.9% most recently). Relative to the industry median (about +19.8%), the company’s current growth rate is still far below typical peer growth levels.
Cash generation can act as a practical support for operations (funding restructuring, product improvements, and debt service). Rackspace’s free cash flow has remained positive in the periods shown, although it has been volatile and well below earlier levels.
Trailing twelve-month free cash flow declined from about $241M (2022) to about $107M (2023), rose to about $174M (2024), then fell to about $51.5M (2025) before improving to about $76.9M (2026 period shown). This pattern indicates the business has generated cash overall, but not consistently at a high level.
Potential catalysts (in general, based on how this type of company improves results) typically include successful turnaround initiatives that stabilize revenue, improved service margins, tighter cost control, and sustained customer retention in managed services. Whether those catalysts materialize depends on management execution and competitive dynamics.
Risks (High)
A central risk is profitability. Even though the latest margin shown has improved compared with the deep losses in 2023–2024, it is still negative, while the industry median has moved into positive territory. Persistent losses can limit flexibility (for example, in hiring, product development, and pricing) and can raise the importance of financing structure.
Profit margin improved from very negative levels (roughly -28% to -44% during parts of 2023–2024) to about -5.4% most recently. That improvement is meaningful, but it still trails the industry median of about +7.0%, implying the company remains behind typical peer profitability.
Another important risk is leverage and balance-sheet complexity. The debt-to-equity metric shown becomes extreme and even negative in recent periods, which often happens when a company’s accounting equity is very small or negative (for example, after large accumulated losses or write-downs). In that situation, debt-to-equity can be difficult to interpret in the usual “how levered is the company?” sense, but it still signals that the capital structure deserves close attention.
Earlier in the period shown, debt-to-equity was several hundred percent (for example, around 288%–612% in 2021–2022), spiked to very large values in early 2023, and then turned negative in late 2023 onward (most recently around -265%). By contrast, the industry median is far lower (roughly in the 13%–33% range depending on the quarter shown). This gap highlights that Rackspace’s balance-sheet profile is unusual relative to typical peers.
Competition is also a core risk. Rackspace operates alongside large global IT services and consulting firms and cloud-focused managed service providers. Competitors can include:
- Global IT services firms with broad enterprise relationships and scale
- Systems integrators and consulting companies that lead cloud migrations and modernization projects
- Cloud providers and their partner ecosystems, which can sometimes reduce the need for a third-party operator in certain use cases
Rackspace’s competitive advantages are generally tied to its operational experience and managed services capabilities across multiple clouds, but it is not the clear industry leader by scale compared with the largest IT services firms. In markets like cloud operations and modernization, size, pricing power, and breadth of offerings can matter, which can make sustained differentiation difficult.
Finally, the stock’s higher beta indicates elevated volatility risk. Even when company fundamentals improve, the share price can move sharply with market sentiment, financing concerns, or quarterly results.
Valuation
A common valuation shortcut for stocks is the price-to-earnings (P/E) ratio, but it is not informative here because the company’s P/E is shown as 0 (typically reflecting losses or otherwise non-meaningful earnings). For context, the industry median P/E in the chart is around the high-20s to low-30s range, which is more typical for profitable companies in this category.
When P/E is not usable, investors often focus more on operating trends (revenue stabilization, margin improvement), cash flow, and balance-sheet resilience. With a market cap around $1.45B, the company’s valuation is closely tied to whether it can sustain the recent improvement in margins and keep cash flow positive while operating in a competitive services market. The combination of modest growth (latest ~+1.9% YoY), still-negative margins, and an unusual leverage profile can make valuation harder to anchor to standard peer comparisons.
Conclusion
Rackspace Technology is positioned in a long-term relevant area—helping organizations operate and modernize cloud and IT environments—but recent history shows uneven performance at the company level. Revenue has trended downward over multiple years, profitability has been negative (though improving recently), and the balance-sheet signals elevated financial complexity relative to typical peers. At the same time, the company has reported positive trailing free cash flow, and its latest profit margin shows a notable recovery from the worst levels seen in 2023–2024.
For a long-term perspective, the key facts to track are whether revenue growth becomes consistently positive, whether profit margins can move from slightly negative to sustainably positive (closer to industry norms), and whether the company’s capital structure becomes simpler and more resilient over time. These elements are likely to matter more than traditional earnings-multiple comparisons until profitability is firmly established.
Sources:
- U.S. Securities and Exchange Commission (SEC) EDGAR — Rackspace Technology, Inc. filings (Form 10-K, Form 10-Q)
- Rackspace Technology, Inc. — Investor Relations materials and SEC filing copies (company-hosted)
- Wikipedia — “Rackspace Technology” (basic company background)
This article is for informational purposes only and does not constitute financial advice. Some content is AI-generated. See Disclaimer