Stock Analysis · Formula One Group (FWONB)
Overview
Formula One Group (FWONB) is the business behind the FIA Formula One World Championship. In practical terms, it commercializes the sport: it organizes and promotes the racing series and sells the rights that allow broadcasters, sponsors, and race promoters to monetize the events. The company’s model is built around long-term contracts and global distribution, with a calendar of races that creates recurring demand for media content and on-site experiences.
In its reporting, Formula One typically describes three main revenue streams:
- Primary (largest): Race promotion fees paid by hosts/promoters to stage Grand Prix events (often structured as multi-year agreements).
- Primary: Media rights from broadcasting and streaming agreements across countries/regions.
- Primary: Sponsorship and related commercial partnerships (including trackside advertising and series-level sponsors).
The business is often described as asset-light compared with many entertainment models: it does not need to build stadiums globally, but it does carry meaningful operating costs to run events and produce a premium broadcast product.
From 2021 to 2024, total revenue increased from about $2.14B to about $3.65B. Over the same period, operating income rose versus 2021 but did not move in a straight line, and net income was volatile (positive in 2022 and 2023, slightly negative in 2024). Interest expense remained material (roughly $123M–$214M per year in the period shown), which can meaningfully influence bottom-line results.
Key Figures
| Metric | Value | Industry ⓘ |
|---|---|---|
| Date | Feb 08, 2026 | |
| Context | ||
| Sector | Communication Services | |
| Industry | Entertainment | |
| Market Cap ⓘ | $21.71B | |
| Beta ⓘ | 0.71 | |
| Fundamental | ||
| P/E Ratio ⓘ | N/A | 50.96 |
| Profit Margin ⓘ | 5.50% | 4.93% |
| Revenue Growth ⓘ | 19.10% | 5.20% |
| Debt to Equity ⓘ | 65.10% | 74.97% |
| PEG ⓘ | 3.65 | |
| Free Cash Flow ⓘ | $1.25B | |
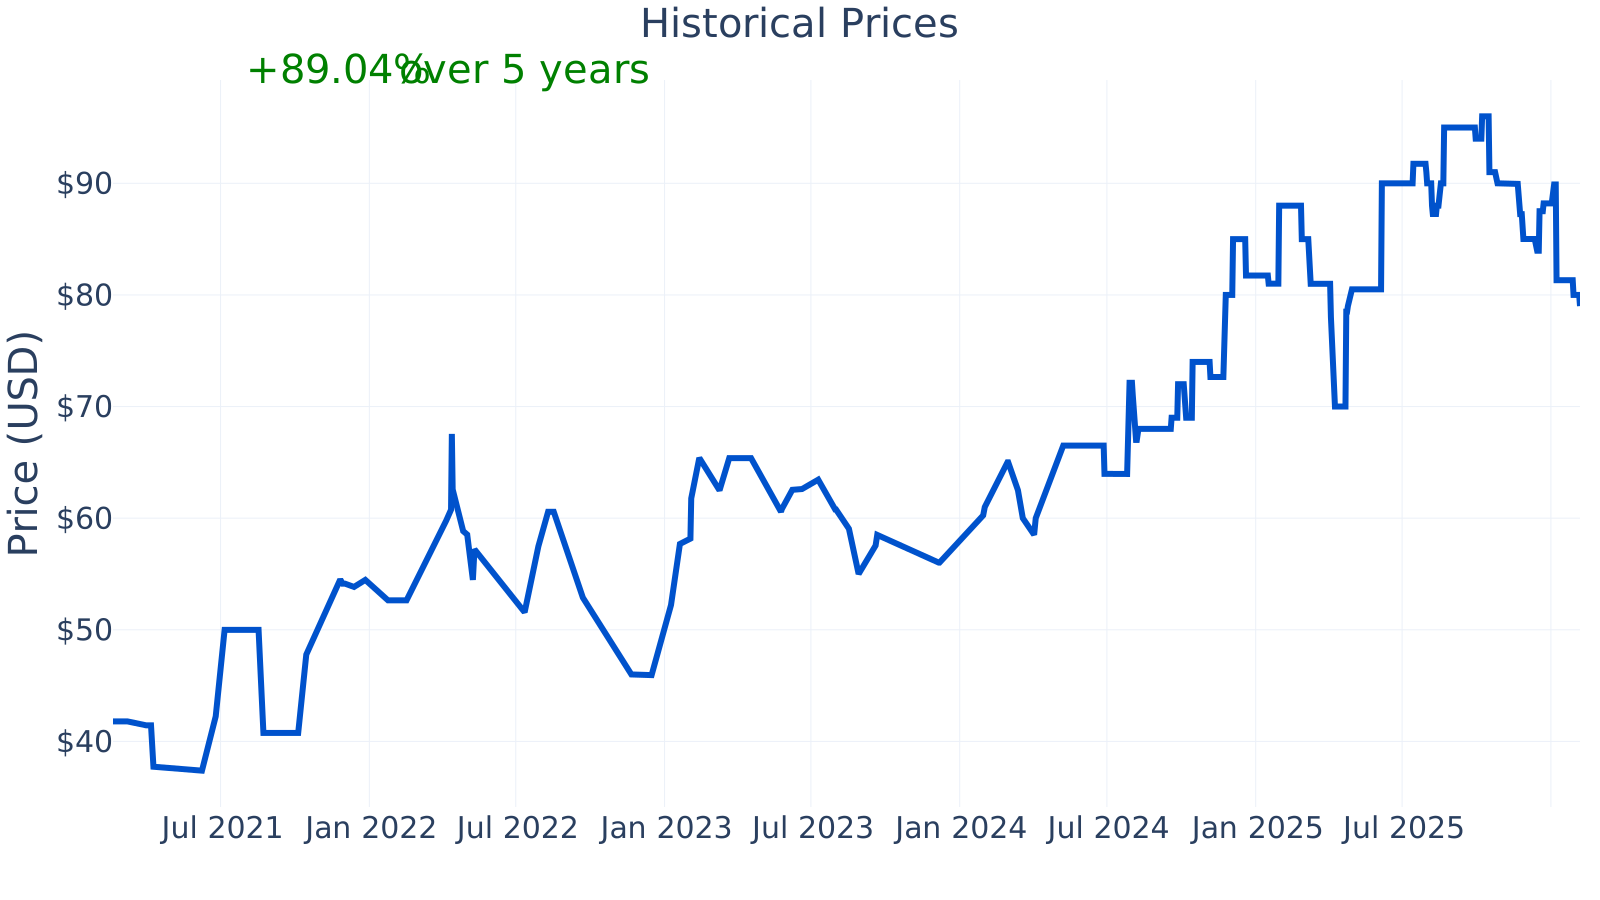
Based on the latest metrics shown: the company’s market capitalization is about $21.7B, and the stock’s beta of 0.71 suggests it has historically moved less than the broader market on average (beta is a backward-looking measure). The profit margin is about 5.5% versus an industry median near 4.9%. Year-over-year revenue growth is about 19.1% versus an industry median near 5.2%. Debt-to-equity is about 65%, below the industry median near 75%. Free cash flow over the trailing twelve months is about $1.25B. The PEG ratio shown (3.649) is a reminder that valuation can look demanding if growth expectations cool.
Growth (Medium)
Formula One sits within global sports and live entertainment—an area supported by ongoing demand for premium, must-watch content. Top-tier live sports can be especially valuable because audiences tend to watch in real time, which supports both advertising and subscription models for media partners. That said, growth is not guaranteed: it depends on the ability to sustain fan engagement, maintain a strong race calendar, and renew commercial agreements at favorable terms.
A key element of the strategy is expanding and deepening monetization across multiple channels: long-term media agreements, multi-year race-hosting contracts, and sponsorship packages. The company also benefits from global reach (multiple geographies, multiple time zones) that can diversify demand compared with a sport concentrated in one country.
Revenue growth has been volatile quarter to quarter, with several very strong periods (including elevated growth rates in 2024) and some negative year-over-year quarters. The most recent figure shown is about 19.1% year over year, which is higher than the industry median in the same comparison set.
Free cash flow improved substantially across the period shown: from roughly -$113M (TTM, 2021) to about $1.13B (TTM, 2025-03-31) and about $1.25B in the latest metric snapshot. For a business that must continually invest in event operations and content production, stronger free cash flow can increase financial flexibility (for example, reinvestment, debt reduction, or other corporate purposes).
Potential catalysts (in a neutral, factual sense) typically come from contract renewals and new deals: media rights agreements, sponsorship renewals, and additions/changes to the race calendar. Because these agreements can be large and multi-year, outcomes can have an outsized impact on future results.
Risks (Medium-High)
Formula One’s economics are attractive when global interest is strong, but the business also carries distinct risks. A major one is contract concentration and renewal risk: a relatively small number of high-value media partners, sponsors, and race promoters can represent a meaningful portion of revenue, and terms can change at renewal. Another is event and operational risk: the calendar depends on successful execution across many countries, and disruptions (logistics, regulation, local conditions) can reduce event-related revenue and increase costs.
There is also reputation and governance risk common to major sports properties (rule enforcement, competitive balance, and stakeholder relationships). In addition, while Formula One is the clear leader within its own championship, it still competes for attention and time against many entertainment options, including other global sports leagues and series.
Leverage has improved significantly compared with 2021–2023 levels. The latest debt-to-equity shown is about 65%, which is below the industry median near 75%, though the history indicates periods where leverage was much higher. Even with improved leverage, ongoing interest expense can remain a factor for net income when rates or refinancing conditions change.
Profitability has also been uneven. The latest profit margin shown is about 5.5%, roughly in line with the industry median, but the historical series includes periods of much higher margins and also periods that dip negative. This pattern suggests that one-time items, seasonality, and cost swings can materially affect reported earnings from quarter to quarter.
On competitive position, Formula One’s main advantage is the combination of scarcity and brand: there is only one FIA Formula One World Championship, with a long operating history and a globally recognized format. That said, “competition” is less about another identical product and more about competing for viewers, sponsors’ budgets, and media rights dollars versus other premium sports and entertainment properties.
Valuation
Valuation can be framed in simple terms as what the market is paying today for a stream of future earnings and cash flows. For Formula One Group, one common reference point is the price-to-earnings (P/E) ratio, although it can be less stable when net income is volatile.
The chart shows periods where the company’s P/E ratio is above the industry median in the same comparison set (for example, late 2024 through late 2025 in the points shown). This typically implies higher growth expectations or greater confidence in the durability of the business model—or, alternatively, that current earnings are temporarily depressed, which mechanically raises the P/E. The PEG ratio shown in the key metrics (3.649) is consistent with the idea that the valuation can look more demanding when adjusted for growth assumptions.
Because net income has been volatile (including a slightly negative year in the overview period), many readers also look at cash generation as a reality check. The recent improvement in free cash flow provides supportive context, but valuation remains sensitive to future contract terms, calendar expansion/stability, and cost control.
Conclusion
Formula One Group is a global sports and entertainment rights business built around recurring events and long-term commercial agreements. The company has grown revenue meaningfully since 2021 and has recently shown strong year-over-year growth alongside a sharp improvement in trailing free cash flow. At the same time, reported profitability and earnings have been uneven, and interest expense has been meaningful, which can amplify swings in net income.
Overall, the long-term picture depends on sustained global demand for Formula One content and the company’s ability to renew and expand media rights, sponsorships, and race-hosting contracts while managing costs and operational complexity. The valuation indicators shown suggest the market has, at times, priced the shares at a premium to the industry median, which increases sensitivity to disappointments in growth or margins.
Sources:
- SEC EDGAR — Liberty Media Corporation filings (Formula One Group reporting): Form 10-K (Annual Report) and Form 10-Q (Quarterly Report)
- Liberty Media / Formula One Group — Investor Relations materials (press releases and shareholder communications, where applicable)
- Wikipedia — “Formula One Group” (basic background and business description)
This article is for informational purposes only and does not constitute financial advice. Some content is AI-generated. See Disclaimer