Stock Analysis · Kopin Corporation (KOPN)
Overview
Kopin Corporation (KOPN) is a small technology company that develops and supplies specialized components used in compact display systems. In plain terms, it focuses on the “parts inside” devices that need lightweight, low-power visuals—often in applications where size, durability, and power efficiency matter more than having a large screen. Across its public filings, Kopin describes its business around microdisplays and optical/display-related technologies that can be used in areas such as defense products and other head-worn or compact display solutions.
Because the end-products are frequently built by larger manufacturers or government contractors, Kopin’s role is typically as a component supplier (and in some cases a technology/licensing provider). This type of business can lead to revenue that is influenced by customer program timelines, contract awards, and product cycles rather than steady consumer demand.
In its SEC filings, Kopin groups revenue into categories/segments that reflect its product mix and end markets. A simple way to think about the company’s revenue sources is:
- Product revenue (selling components such as display-related products)
- Development/contract-related revenue (work tied to specific programs/projects, often with defense-oriented customers)
- Other revenue streams described in filings (for example, technology-related arrangements when applicable)
For precise percentages by segment and period, Kopin’s most recent annual report (Form 10-K) is the primary reference, since mix can change year to year based on program activity and customer orders.
Looking across recent years in the profitability “flow” (revenue to costs to bottom line), a recurring pattern is that operating costs (notably selling/general/administrative and research/development) have often outweighed gross profit. That relationship matters for long-term shareholders because it highlights how important scale (higher revenue) and/or expense control are for producing consistent operating profits.
Key Figures
| Metric | Value | Industry ⓘ |
|---|---|---|
| Date | May 18, 2026 | |
| Context | ||
| Sector | Technology | |
| Industry | Electronic Components | |
| Market Cap ⓘ | $923.75M | |
| Beta ⓘ | 3.40 | |
| Fundamental | ||
| P/E Ratio ⓘ | N/A | 45.67 |
| Profit Margin ⓘ | 5.00% | 5.64% |
| Revenue Growth ⓘ | 0.10% | 17.85% |
| Debt to Equity ⓘ | 1.93% | 18.41% |
| PEG ⓘ | 8.75 | |
| Free Cash Flow ⓘ | -$15.17M | |
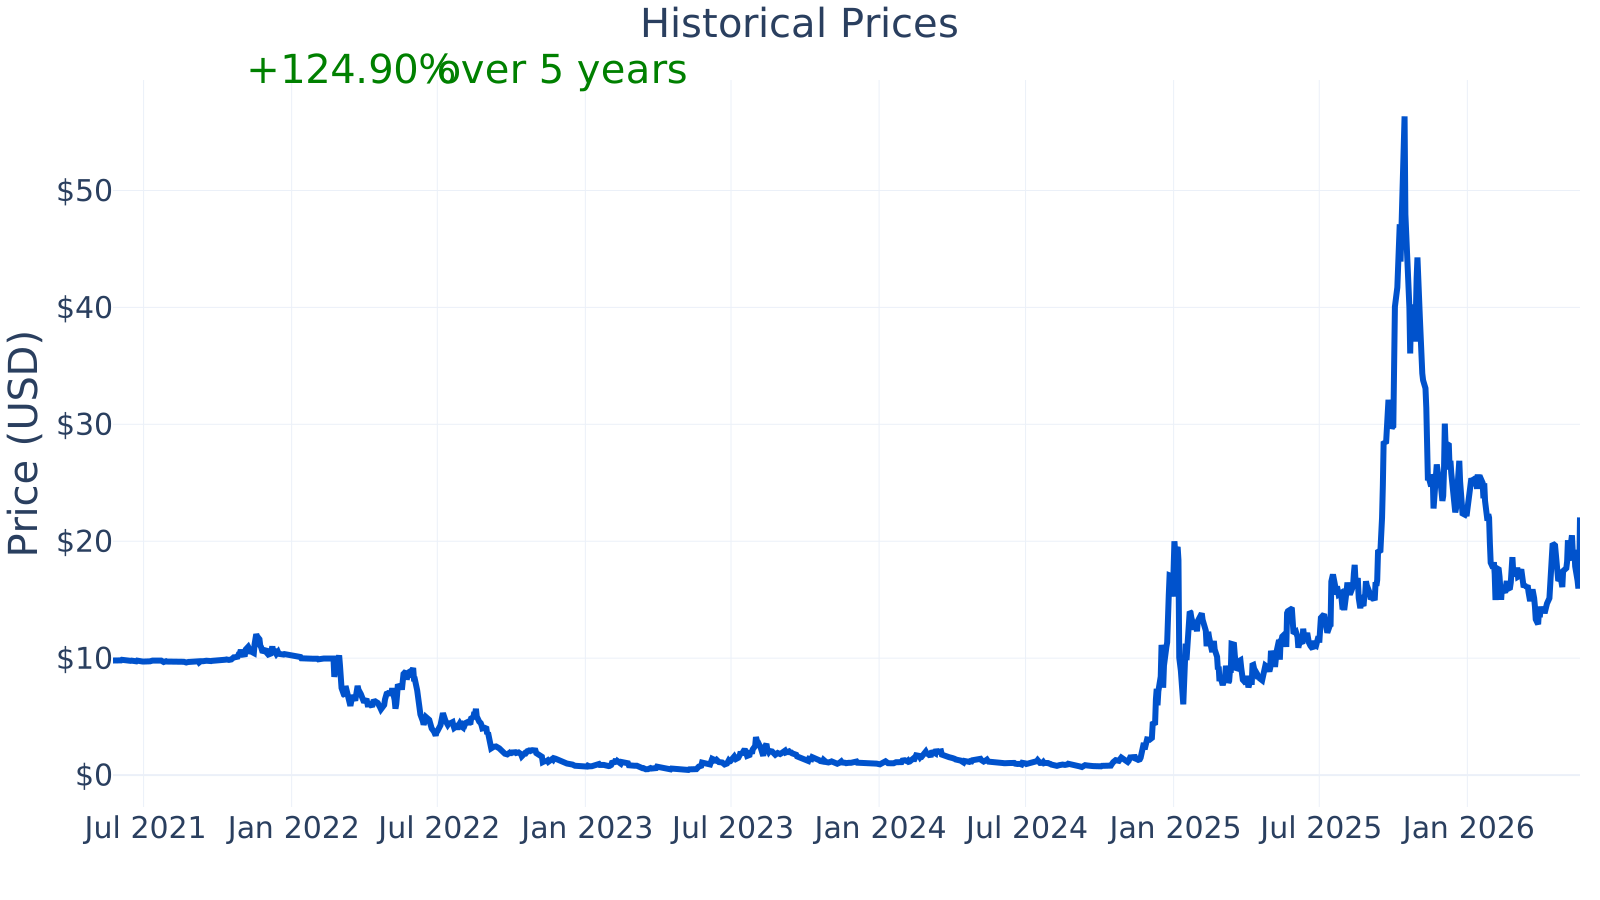
Kopin’s market capitalization is about $924 million, placing it in the small-cap range. The stock’s beta of 3.4 signals that the share price has historically moved much more than the overall market (up and down), which can matter for long-term investors who prefer steadier price behavior.
On profitability, the latest profit margin is about 5.1%, close to the listed industry median (about 5.7%). This is a notable change versus earlier periods shown later in the margin chart, where profitability was often negative.
On growth, the latest year-over-year revenue growth is about 0.1%, well below the industry median shown in the table (about 17.9%). This suggests that, at least in the most recent period captured here, the company has not been expanding sales at the pace seen across many peers in the same broad industry grouping.
Balance-sheet leverage appears low based on debt-to-equity of about 1.9%, below the industry median (about 18.4%). However, profitability and cash generation also matter: free cash flow over the trailing twelve months is about -$15.2 million, meaning the business used more cash than it produced from operations and investments over that period.
Growth (medium)
Kopin operates in areas connected to ongoing, long-duration trends: smaller and lighter display systems, improved power efficiency, and specialized visual solutions used in high-reliability settings. In general, demand drivers can include modernization cycles in defense systems and continued experimentation and product development in head-worn or compact display categories. These are real, long-term themes—but the timing of revenue can be uneven because programs ramp and pause, and certain customer decisions can meaningfully affect a company of Kopin’s size.
From a strategy perspective, the logic is straightforward: if Kopin’s components become “designed into” larger programs or platforms, unit volumes can rise and manufacturing scale can improve cost absorption. In component businesses, a sustained increase in volume is often what changes the financial profile, because fixed costs are spread over more revenue.
The year-over-year revenue growth history shown here is volatile: there are quarters with strong positive growth (including a very large spike in late 2024), followed by periods of contraction. The most recent point is close to flat (~0.1%), which reinforces the idea that the company’s sales can be program-driven rather than smoothly compounding.
Free cash flow has been consistently negative over multiple years in this view (roughly -$14 million to -$20 million range). For long-term owners, a key growth question is whether the company can translate its product and program activity into sustained cash generation, since negative free cash flow over long periods may require funding through existing cash, new financing, or issuing shares.
Potential catalysts described in company materials typically involve new program wins, transitions from development phases into production phases, and broader adoption of the company’s technologies in end markets it targets. The main uncertainty is that these are often difficult for outsiders to time, and they can be concentrated in a limited number of customers.
Risks (high)
Kopin’s risk profile is shaped by (1) customer and program concentration typical of specialized component suppliers, (2) historically uneven profitability, and (3) the need to convert product development into sustained production revenue. If a major program is delayed, redesigned, reduced, or canceled, the impact can be significant relative to the company’s scale.
Debt-to-equity is currently low (about 1.9%), which indicates limited reliance on debt financing at this point. The chart also shows periods where the ratio moved sharply, including an unusual negative reading in 2024 (which can occur when accounting equity turns negative). That kind of swing is a reminder that balance-sheet measures can change quickly when losses are large and equity is pressured.
Profitability has improved substantially over time in this chart—from deeply negative margins in many quarters to a recent positive level (about 5.1%). Even with that improvement, the history matters: it shows the business has not always been able to keep costs aligned with revenue, and future margins may depend on maintaining volume, mix, and expense discipline.
On competitive positioning, Kopin participates in markets where it competes for design wins against other display component and microdisplay suppliers, as well as against alternative technical approaches that can reduce the need for Kopin’s components. Competition can involve performance (brightness, resolution, power), reliability, qualification requirements, pricing, and the ability to deliver at scale. Kopin’s potential advantages—based on how such component markets work—tend to be tied to specialized know-how, customer qualifications, and the difficulty of switching components once a system is designed and validated. However, leadership is difficult to assert in a simple way because multiple vendors can serve different programs, and end-customer requirements vary widely.
Valuation
The P/E chart is difficult to interpret for much of the period because P/E ratios become meaningless when earnings are negative (or extremely small), which is why many earlier points are shown as 0. In the latest point shown, Kopin has a P/E of about 182.7 versus an industry median near 43.0. A high P/E can occur when profits have only recently turned positive or are still relatively small compared with the market value, meaning the ratio can change dramatically with small earnings swings.
Given the combination of (a) volatile revenue growth, (b) a history of losses with recent improvement, and (c) negative trailing free cash flow, valuation discussions tend to depend heavily on whether earnings and cash flow can stabilize and grow. When profitability is not yet consistent, some investors focus more on cash runway, revenue quality (repeatability and customer concentration), and evidence that programs are moving from development into sustained production.
Conclusion
Kopin is a specialized component company whose long-term outcomes are closely tied to program adoption and production ramps in its target markets. The business operates in areas aligned with durable technology themes, but the financial history shown here highlights uneven revenue growth, a multi-year pattern of negative free cash flow, and a profitability profile that has only recently turned positive.
From a long-term perspective, the central question is whether Kopin can convert its technology and customer programs into steadier, higher-volume revenue that supports durable operating profits and positive free cash flow. At the same time, the stock’s high beta and the company’s historically variable fundamentals suggest that outcomes may remain sensitive to program timing, customer decisions, and execution on cost structure.
Sources:
- SEC EDGAR — Kopin Corporation Form 10-K (Annual Report)
- SEC EDGAR — Kopin Corporation Form 10-Q (Quarterly Reports)
- SEC EDGAR — Kopin Corporation Form 8-K (Current Reports)
- Kopin Corporation Investor Relations — SEC Filings & official press releases
- Wikipedia — “Kopin Corporation” (basic company background)
This article is for informational purposes only and does not constitute financial advice. Some content is AI-generated. See Disclaimer