Stock Analysis · Uber Technologies Inc (UBER)
Overview
Uber Technologies operates a large digital platform that connects riders with drivers, diners with restaurants and couriers, and businesses with freight carriers. In simple terms, it is best known for ride-hailing, but the company has grown into a broader logistics network built around moving people, meals, groceries, and goods. Uber reports results mainly through three operating segments: Mobility, Delivery, and Freight.
The business model is asset-light compared with traditional transportation companies. Uber generally does not own large fleets of cars or trucks. Instead, it earns fees from transactions completed on its platform, plus advertising and certain service-related revenues. That structure has helped the company scale globally while steadily improving profitability.
Based on recent annual reporting, Uber’s revenue mix is led by mobility, followed by delivery, then freight.
- Mobility: about 56% of revenue. This includes ride-hailing services such as trips booked through the Uber app, along with related platform fees.
- Delivery: about 33% of revenue. This includes Uber Eats restaurant delivery, grocery and retail delivery, and advertising revenue tied to the delivery marketplace.
- Freight: about 11% of revenue. This includes freight brokerage and logistics services connecting shippers and carriers.
What stands out is that Uber’s economics have become much stronger over the last few years. Revenue has expanded sharply since 2021, while operating income and net income have turned positive. The biggest improvement has come from scale: more usage on the platform, denser local networks, and better cost discipline have allowed a larger share of each revenue dollar to reach the bottom line.
The long-term trend shows a business that is no longer just chasing growth. Revenue has risen from roughly $17 billion in 2021 to more than $52 billion in 2025, while operating profit has moved from large losses to several billion dollars in the black. That shift matters because it suggests Uber is becoming a more mature platform with clearer earnings power.
Key Figures
| Metric | Value | Sector ⓘ |
|---|---|---|
| Date | Sep 12, 2026 | |
| Context | ||
| Sector | Technology | |
| Industry | Software - Application | |
| Market Cap ⓘ | $146.39B | |
| Beta ⓘ | 1.16 | |
Value (Cheapness) | ||
| P/E Ratio ⓘ | 15.93 | 29.51 |
| FCF Yield ⓘ | 6.91% | 4.25% |
| EBIT / EV ⓘ | 4.60% | 2.85% |
| PEG ⓘ | 6.15 | |
Growth (Business expansion) | ||
| Revenue Growth ⓘ | 12.20% | 15.40% |
| RPS Growth (5Y CAGR) ⓘ | 28.66% | 8.56% |
| EPS Growth (5Y CAGR) ⓘ | N/A | -11.88% |
| Margin Growth (5Y Trend) ⓘ | 33.96% | 0.46% |
| FCF Growth (5Y CAGR) ⓘ | N/A | 9.80% |
Quality (Business durability) | ||
| ROIC (Latest) ⓘ | 27.22% | 9.44% |
| ROIC (5Y Median) ⓘ | 14.41% | 8.30% |
| Net Debt / EBIT (Latest) ⓘ | 1.36 | 0.54 |
| Net Debt / EBIT (5Y Median) ⓘ | 1.08 | 0.44 |
| Operating Margin (Latest) ⓘ | 13.12% | 9.58% |
| Operating Margin (5Y Median) ⓘ | 7.92% | 8.25% |
| Debt to Equity (Latest) ⓘ | 53.93% | 33.33% |
| Profit Margin (Latest) ⓘ | 17.35% | 7.14% |
| Free Cash Flow (Latest) ⓘ | $10.12B | |
Momentum (Price trend) | ||
| 3Y Return ⓘ | +49.56% | +45.48% |
| 12M Return (excl. last month) ⓘ | -17.85% | +23.48% |
| 6M Return ⓘ | -1.78% | +20.93% |
| Price vs. 200-Day MA ⓘ | -5.73% | +7.43% |
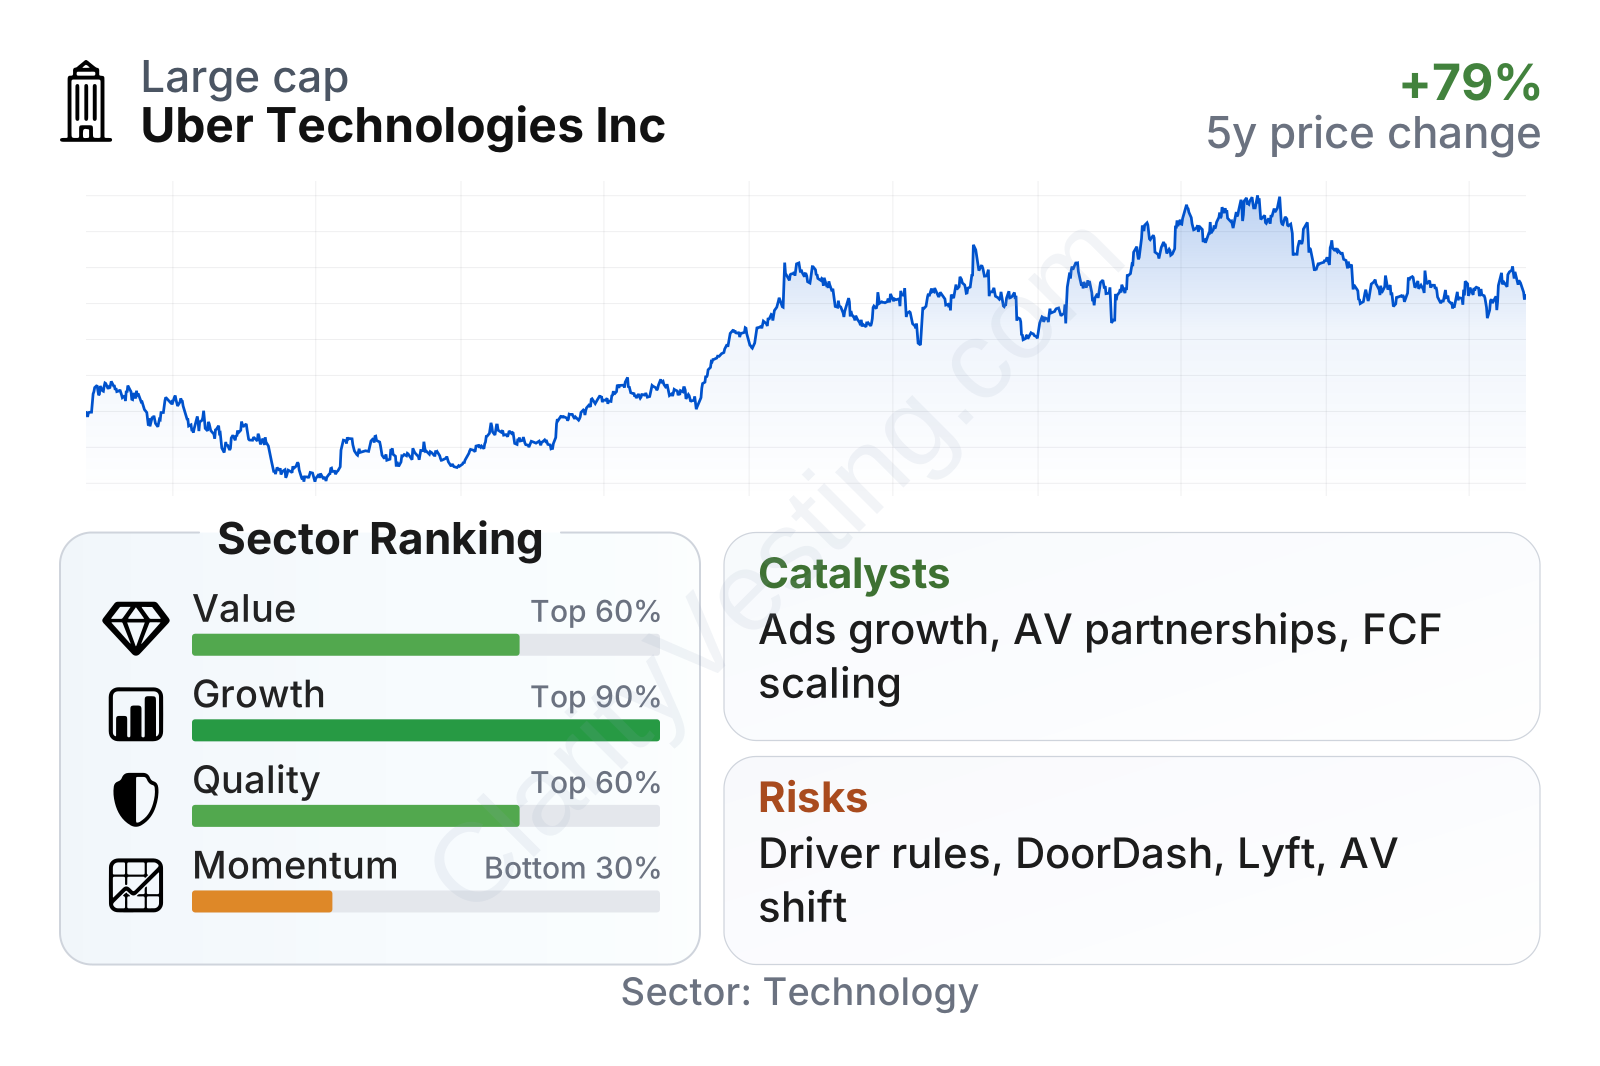
Uber is now a very large platform company with moderate share-price volatility relative to many technology names. The factor profile is unusual in a positive way: growth remains strong over a multiyear period, quality has improved materially, and valuation looks lighter than much of the software sector. The weaker area is short-term momentum, reflecting a notable pullback over the last year even though the longer three-year share performance remains strong.
Growth
Uber operates in markets with durable long-term demand. Urban transportation, restaurant delivery, local commerce, and logistics are all large categories that continue to shift toward app-based coordination. That does not mean growth will always be rapid, but it does mean Uber is exposed to sectors where digital platforms can keep taking share from offline or fragmented alternatives.
The strategy also makes sense from a platform perspective. Mobility and Delivery reinforce each other because they use overlapping technology, consumer demand, mapping, payments, and local marketplace operations. That can improve efficiency and brand reach. Freight is less connected to the consumer side, but it extends Uber’s logistics capabilities into a very large business market.
Growth has normalized from the exceptional rebound period after the pandemic, but it is still healthy. Recent year-over-year revenue growth has been running in the low teens, after much faster recovery-driven gains in earlier years. More important than the slowdown itself is the quality of that growth: Uber has paired continued expansion with rising operating margins, which is usually a stronger sign than growth alone.
Cash generation has become one of the clearest strengths. Free cash flow has climbed from slightly negative territory in 2022 to nearly $10 billion on a trailing basis by early 2026, and the latest snapshot points above $12 billion. That suggests Uber’s platform is no longer just growing volumes; it is converting a meaningful portion of activity into cash that can support debt reduction, acquisitions, or investment in new initiatives.
Several catalysts could support the next phase. Advertising inside Uber Eats is still relatively young and can lift margins because ad revenue tends to be higher quality than transaction revenue. Corporate travel and airport usage can continue to support Mobility. Grocery and retail delivery broaden the Delivery business beyond restaurant orders. Uber is also investing in autonomous vehicle partnerships, which could become strategically important if self-driving networks scale commercially over time.
Recent company updates have also highlighted expansion in autonomous vehicle collaborations, including additional partnerships aimed at putting self-driving options onto Uber’s network rather than building the hardware entirely on its own. That partner-based approach lowers capital intensity and could make Uber a distribution layer for autonomous mobility if the technology becomes more widely adopted.
Risks
This article is for informational purposes only and does not constitute financial advice. Some content is AI-generated. See Disclaimer


