Stock Analysis · Trade Desk Inc (TTD)
Overview
Trade Desk is a digital advertising technology company. Its platform helps advertising buyers plan, purchase, measure, and optimize ad campaigns across channels such as connected TV, online video, mobile, display, audio, and digital out-of-home. In simple terms, it is software used by agencies and brands to decide where to place ads and how to get better results from their budgets.
The company operates on the “buy side” of advertising, which means it works for advertisers rather than for publishers selling ad space. That positioning matters because it lets Trade Desk present itself as an independent platform focused on helping clients spend efficiently across many media owners instead of steering budgets toward its own content properties.
Trade Desk does not break out revenue by channel in a precise percentage schedule in its latest company reporting, but its business model is clear. Revenue mainly comes from platform fees tied to advertising spend that runs through its system. Connected TV has been repeatedly described by management as its largest and fastest-growing channel, while mobile, display, video, audio, and other omnichannel formats make up the rest.
- Platform fees on ad spend: the core revenue source, generated when advertisers and agencies use Trade Desk’s software to buy and manage campaigns.
- Connected TV: the most important channel within the platform, covering streaming television advertising on internet-delivered TV services.
- Mobile, online video, display, and native: ad buying across apps, websites, and digital video environments.
- Audio and digital out-of-home: smaller but growing categories including streaming audio and digital billboards or public screens.
- Data and measurement-related capabilities: these support the platform’s value proposition, though they are generally embedded in the core business model rather than disclosed as a separate major revenue line.
Over the last several years, the company has expanded revenue while also improving profitability. Revenue rose from about $1.2 billion in 2021 to about $2.9 billion in 2025, while operating income and net income increased materially. That combination suggests a business that is not only getting bigger, but also converting more of its scale into earnings.
The financial flow shows a favorable pattern: gross profit has expanded steadily, operating expenses have grown more slowly than revenue in recent years, and operating income has widened meaningfully since 2022. Research and development remains a significant expense, which is consistent with a platform business still investing in product capabilities.
Key Figures
| Metric | Value | Sector ⓘ |
|---|---|---|
| Date | Sep 12, 2026 | |
| Context | ||
| Sector | Communication Services | |
| Industry | Advertising Agencies | |
| Market Cap ⓘ | $6.56B | |
| Beta ⓘ | 1.00 | |
Value (Cheapness) | ||
| P/E Ratio ⓘ | 16.63 | 18.61 |
| FCF Yield ⓘ | 13.11% | 13.68% |
| EBIT / EV ⓘ | 11.74% | 4.54% |
| PEG ⓘ | 1.00 | |
Growth (Business expansion) | ||
| Revenue Growth ⓘ | 3.00% | 5.40% |
| RPS Growth (5Y CAGR) ⓘ | 25.74% | 4.62% |
| EPS Growth (5Y CAGR) ⓘ | -23.05% | -18.01% |
| Margin Growth (5Y Trend) ⓘ | 12.46% | 1.10% |
| FCF Growth (5Y CAGR) ⓘ | 25.72% | 5.88% |
Quality (Business durability) | ||
| ROIC (Latest) ⓘ | 16.10% | 8.38% |
| ROIC (5Y Median) ⓘ | 10.94% | 8.32% |
| Net Debt / EBIT (Latest) ⓘ | -1.07 | 1.99 |
| Net Debt / EBIT (5Y Median) ⓘ | -2.46 | 2.94 |
| Operating Margin (Latest) ⓘ | 21.48% | 14.89% |
| Operating Margin (5Y Median) ⓘ | 13.77% | 12.96% |
| Debt to Equity (Latest) ⓘ | 16.86% | 59.59% |
| Profit Margin (Latest) ⓘ | 13.61% | 8.77% |
| Free Cash Flow (Latest) ⓘ | $860.39M | |
Momentum (Price trend) | ||
| 3Y Return ⓘ | -83.29% | +46.64% |
| 12M Return (excl. last month) ⓘ | -74.68% | +2.16% |
| 6M Return ⓘ | -45.94% | +5.05% |
| Price vs. 200-Day MA ⓘ | -41.52% | +2.88% |
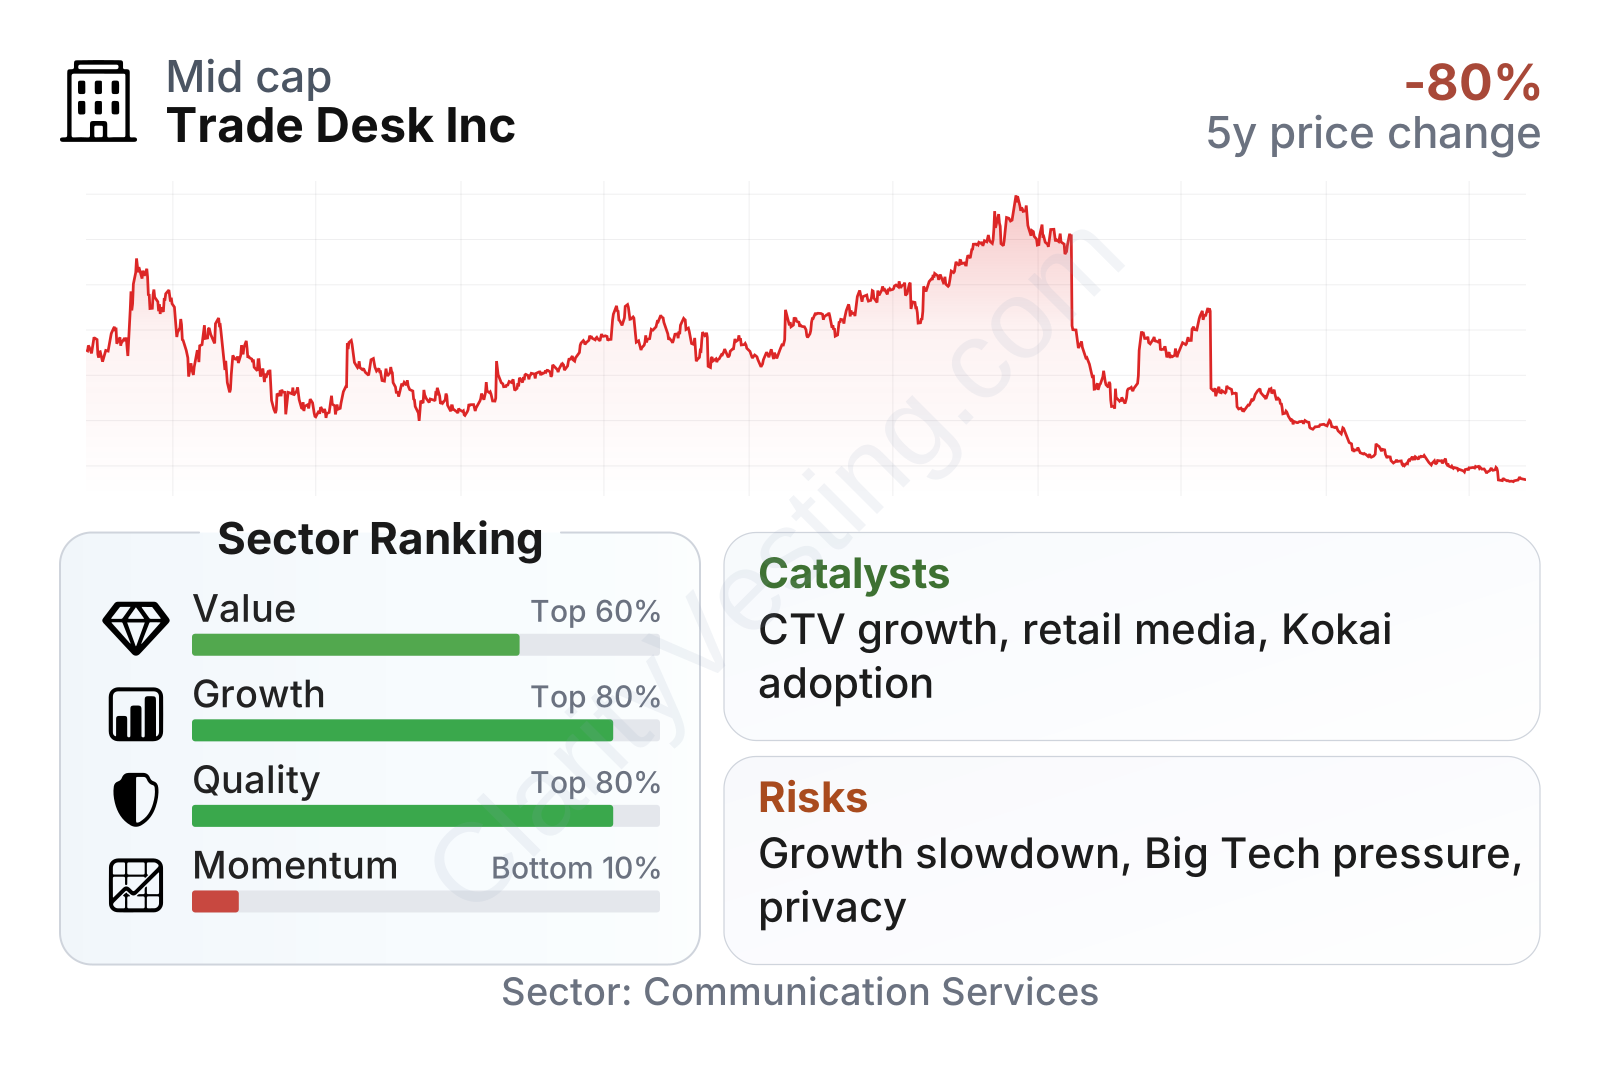
The overall profile is unusual in a good way: the company ranks strongly on growth and business quality, while recent share-price momentum is very weak. Profitability metrics sit above the sector median, debt is low, and cash generation is strong. On valuation metrics, the stock no longer appears to carry the extreme premium it had in earlier years, largely because the share price has fallen sharply while earnings and cash flow improved.
The stock-price history is especially important for context. Trade Desk’s shares were priced for very high expectations in 2021 and 2024, then dropped heavily into 2025 and 2026. That decline does not automatically mean the business deteriorated to the same degree. In fact, several core operating metrics still point to a profitable and financially solid company, which creates a large gap between market sentiment and business fundamentals.
Growth
Trade Desk operates in digital advertising, a segment that continues to gain share from traditional media. Within digital advertising, connected TV remains one of the most important long-term growth areas because ad dollars are following audience attention from traditional linear television to streaming. That trend fits directly with the company’s strongest positioning. As more TV viewing moves to ad-supported streaming, software that helps buyers allocate campaigns across fragmented streaming inventory becomes more relevant.
The company’s strategy also makes sense for future expansion. It emphasizes an open internet approach, identity tools that help advertisers target audiences in a privacy-conscious environment, and partnerships across major media owners, retailers, and technology platforms. Its Kokai platform and its Unified ID 2.0 framework are part of a broader attempt to improve ad performance while reducing dependence on older tracking methods such as third-party cookies.
Revenue growth has clearly slowed from the very high rates seen in 2021 through 2024. The recent pace is much lower than its own earlier levels and below the sector median on the latest snapshot. Still, the longer-term picture remains strong: five-year revenue-per-share growth remains far ahead of the sector median, showing that the business has compounded well over a multiyear period even if near-term expansion has cooled.
Cash generation is one of the most encouraging parts of the picture. Free cash flow has risen steadily over the past several years, moving from the low hundreds of millions of dollars to well above $800 million on a trailing basis in the available trend. That matters because it shows the platform is not dependent on debt or repeated outside financing to support operations and product development.
Recent company updates have continued to highlight connected TV, retail media, and programmatic adoption as major opportunities. Retail media is particularly notable because large retailers increasingly want automated tools to help brands place ads using shopper data across their digital properties. Trade Desk is not the only company targeting this space, but it is one of the best-known independent demand-side platforms trying to connect advertising budgets across channels rather than in a single closed ecosystem.
Another potential catalyst is the broader shift toward more automated ad buying. As advertisers want clearer measurement, better return on ad spend, and cross-channel planning, independent software platforms can become more valuable. If Trade Desk keeps winning budget share from older manual processes and from less transparent ad buying systems, growth can continue even during a softer overall ad market.
Risks
This article is for informational purposes only and does not constitute financial advice. Some content is AI-generated. See Disclaimer


