Stock Analysis · TE Connectivity Ltd (TEL)
Overview
TE Connectivity Ltd is a global manufacturer of connectors, sensors, and other components that help move power, signals, and data inside equipment. Its products are usually not visible to end users, but they are essential in vehicles, factories, aircraft, medical devices, data centers, and communication networks. In simple terms, TE sells the parts that allow complex machines and electronic systems to connect reliably, often in harsh environments involving heat, vibration, moisture, or high speed data transmission.
The business is spread across large industrial markets rather than consumer gadgets, which gives it exposure to long product cycles and deep customer relationships. That matters because once a connector or sensor is designed into a car platform, factory system, or aircraft application, it is not easy or cheap for the customer to switch suppliers.
Based on the company’s recent annual reporting structure, revenue is mainly generated from three operating segments:
- Transportation Solutions: about 58% of revenue. This is the largest business and includes connectivity and sensor products used in passenger vehicles, commercial transportation, and other mobility applications, especially electrification, safety, and in-vehicle data systems.
- Industrial Solutions: about 28% of revenue. This segment serves industrial equipment, energy, medical technology, aerospace, defense, and parts of the digital infrastructure market with connectors, relays, antennas, and sensor-related products.
- Communications Solutions: about 14% of revenue. This business supplies connectivity products for data and devices, including data centers, appliances, and communication equipment.
That mix makes TE less dependent on one single end market than many smaller component companies, although automotive remains the biggest driver by far.
Over the last several years, the business has shown a useful pattern: revenue has been somewhat cyclical, but gross profit and operating income have remained solid, reflecting pricing discipline and a portfolio focused on higher-value applications rather than commodity components.
Key Figures
| Metric | Value | Sector ⓘ |
|---|---|---|
| Date | Sep 12, 2026 | |
| Context | ||
| Sector | Technology | |
| Industry | Electronic Components | |
| Market Cap ⓘ | $61.37B | |
| Beta ⓘ | 1.16 | |
Value (Cheapness) | ||
| P/E Ratio ⓘ | 20.76 | 29.51 |
| FCF Yield ⓘ | 5.93% | 4.25% |
| EBIT / EV ⓘ | 6.20% | 2.85% |
| PEG ⓘ | 0.88 | |
Growth (Business expansion) | ||
| Revenue Growth ⓘ | 13.80% | 15.40% |
| RPS Growth (5Y CAGR) ⓘ | 6.27% | 8.56% |
| EPS Growth (5Y CAGR) ⓘ | 3.74% | -11.88% |
| Margin Growth (5Y Trend) ⓘ | 2.89% | 0.46% |
| FCF Growth (5Y CAGR) ⓘ | 12.69% | 9.80% |
Quality (Business durability) | ||
| ROIC (Latest) ⓘ | 16.87% | 9.44% |
| ROIC (5Y Median) ⓘ | 16.34% | 8.30% |
| Net Debt / EBIT (Latest) ⓘ | 1.11 | 0.54 |
| Net Debt / EBIT (5Y Median) ⓘ | 1.38 | 0.44 |
| Operating Margin (Latest) ⓘ | 20.60% | 9.58% |
| Operating Margin (5Y Median) ⓘ | 17.19% | 8.25% |
| Debt to Equity (Latest) ⓘ | 42.52% | 33.33% |
| Profit Margin (Latest) ⓘ | 15.61% | 7.14% |
| Free Cash Flow (Latest) ⓘ | $3.64B | |
Momentum (Price trend) | ||
| 3Y Return ⓘ | +73.07% | +45.48% |
| 12M Return (excl. last month) ⓘ | +6.38% | +23.48% |
| 6M Return ⓘ | +7.97% | +20.93% |
| Price vs. 200-Day MA ⓘ | -1.12% | +7.43% |
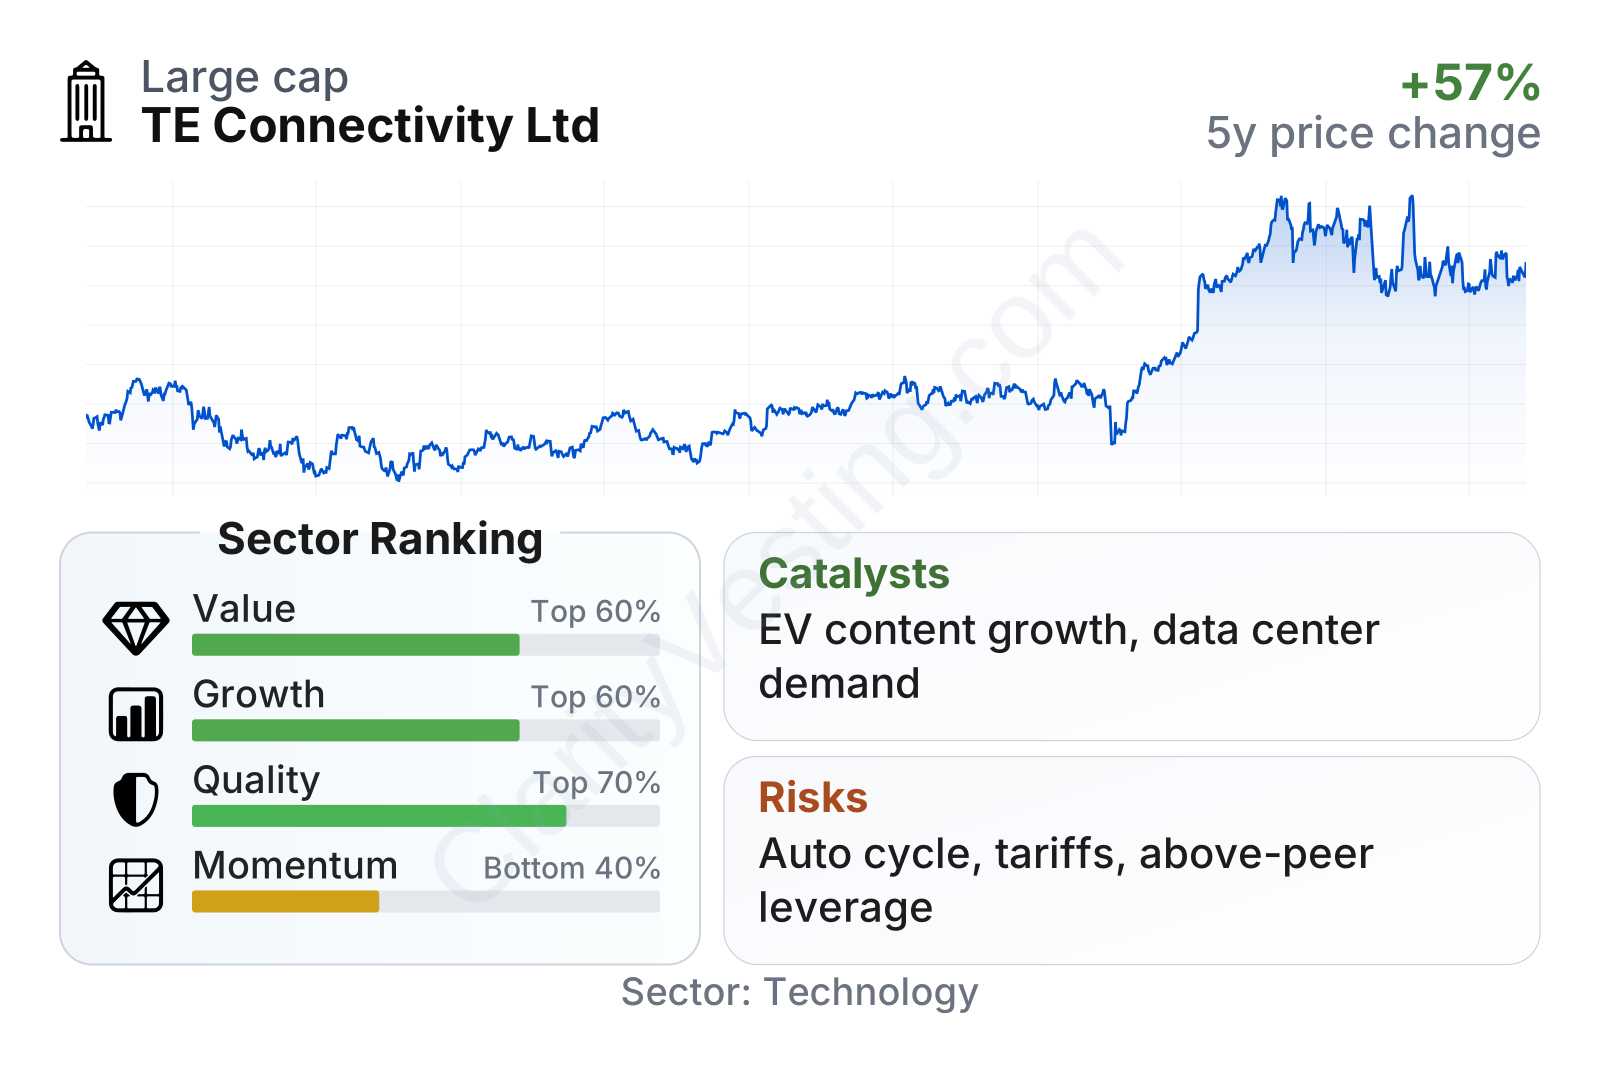
TE Connectivity is a large-cap industrial technology company with a market value around the high tens of billions of dollars and a beta slightly above 1, meaning its shares have tended to move a bit more than the broader market. On valuation, profitability, and cash generation, the company looks stronger than many sector peers. The main softer area is recent share-price momentum, which has cooled after a strong multiyear run.
The stock history shows a business that has gone through cycles but has still produced substantial appreciation over the past several years. The recent pullback from peak levels suggests the market has become more cautious, even though the operating profile remains comparatively healthy.
Growth
TE operates in several markets with durable long-term demand drivers. The most important are vehicle electrification, rising electronic content per vehicle, factory automation, aerospace and defense electronics, medical devices, and the buildout of data infrastructure. These are all areas where systems are becoming more complex and need more reliable power and data connections. That supports demand not just for more units, but for more sophisticated and higher-value components.
The company’s strategy also fits these trends reasonably well. TE has emphasized harsh-environment connectivity, sensor solutions, and applications where reliability matters more than price alone. This tends to support better margins and reduces direct exposure to the most commoditized parts of the electronics supply chain.
Revenue growth has not been perfectly smooth. There was a weaker stretch during the industrial slowdown and inventory correction, followed by a clear reacceleration. More recently, year-over-year growth has returned to the low-to-mid teens range, which suggests TE is benefiting from recovering demand and stronger positioning in its end markets.
Cash generation is another constructive sign. Free cash flow has risen sharply over the last few years, moving from roughly $1.6 billion to more than $3.3 billion on a trailing basis. That improvement matters because it shows the business is not only growing again, but also converting earnings into real cash at an attractive rate.
A notable catalyst is TE’s exposure to automotive electrification. Electric and hybrid vehicles generally require more connectivity and sensing content than traditional internal combustion vehicles. Another catalyst is AI-related and cloud infrastructure spending, which can lift demand for high-speed and power connectivity in data infrastructure. In addition, aerospace and defense demand has remained supportive across the broader industrial supply chain, giving TE another avenue for multi-year expansion.
Recent company communications have also pointed to portfolio shaping and investment in higher-growth niches. That is significant because TE has historically improved results by focusing on categories where engineering depth and customer qualification processes create barriers to entry.
Risks
This article is for informational purposes only and does not constitute financial advice. Some content is AI-generated. See Disclaimer


