Stock Analysis · Teledyne Technologies Incorporated (TDY)
Overview
Teledyne Technologies Incorporated is a specialized industrial technology company that builds high-performance instruments, sensors, cameras, software, and engineered systems used in demanding environments. Its products are typically not consumer-facing. They are used by aerospace and defense customers, factories, laboratories, utilities, marine operators, and medical imaging manufacturers. In simple terms, Teledyne sells mission-critical tools that help customers see, measure, detect, inspect, and monitor things that are difficult to capture with ordinary equipment.
The business is organized into four main segments. Based on the latest annual mix reported by the company, revenue is spread broadly across these activities rather than relying on one single product line.
- Digital Imaging: about 34% of revenue. This includes industrial and scientific cameras, infrared and X-ray imaging, space-grade sensors, and imaging components used in machine vision, defense, medical, and research applications.
- Instrumentation: about 30% of revenue. This covers monitoring and control instruments for marine, environmental, electronic test and measurement, and industrial markets.
- Aerospace and Defense Electronics: about 21% of revenue. This segment provides electronic components, interconnects, data acquisition systems, avionics-related products, and defense electronics.
- Engineered Systems: about 15% of revenue. This includes government-focused systems engineering, marine systems, energy-related technologies, and other custom technical solutions, often tied to longer project cycles.
That mix matters for long-term analysis. Teledyne is not a pure software company and not a commodity manufacturer either. It sits in a middle ground where customers usually care more about performance, reliability, certification, and technical know-how than about finding the cheapest alternative. This tends to support steadier pricing and recurring replacement demand.
The business flow also shows a useful pattern: revenue has climbed from roughly $4.6 billion in 2021 to a little above $6.1 billion in 2025, while operating income and net income also moved higher over that period. Gross profit remained strong even as the company continued to invest in research and absorb manufacturing costs. That combination suggests expansion has not come purely from volume, but also from maintaining discipline on product mix and operating expenses.
Over the last several years, Teledyne has converted a rising revenue base into meaningfully higher operating profit, while interest expense has eased compared with the period following larger acquisitions. That points to improving financial flexibility rather than growth funded by ever-heavier borrowing.
Key Figures
| Metric | Value | Sector ⓘ |
|---|---|---|
| Date | Sep 12, 2026 | |
| Context | ||
| Sector | Technology | |
| Industry | Scientific & Technical Instruments | |
| Market Cap ⓘ | $27.99B | |
| Beta ⓘ | 0.91 | |
Value (Cheapness) | ||
| P/E Ratio ⓘ | 29.17 | 29.51 |
| FCF Yield ⓘ | 4.08% | 4.25% |
| EBIT / EV ⓘ | 4.24% | 2.85% |
| PEG ⓘ | 1.40 | |
Growth (Business expansion) | ||
| Revenue Growth ⓘ | 9.80% | 15.40% |
| RPS Growth (5Y CAGR) ⓘ | 5.50% | 8.56% |
| EPS Growth (5Y CAGR) ⓘ | -11.03% | -11.88% |
| Margin Growth (5Y Trend) ⓘ | 5.34% | 0.46% |
| FCF Growth (5Y CAGR) ⓘ | 10.40% | 9.80% |
Quality (Business durability) | ||
| ROIC (Latest) ⓘ | 7.78% | 9.44% |
| ROIC (5Y Median) ⓘ | 7.50% | 8.30% |
| Net Debt / EBIT (Latest) ⓘ | 1.36 | 0.54 |
| Net Debt / EBIT (5Y Median) ⓘ | 2.51 | 0.44 |
| Operating Margin (Latest) ⓘ | 19.53% | 9.58% |
| Operating Margin (5Y Median) ⓘ | 18.27% | 8.25% |
| Debt to Equity (Latest) ⓘ | 18.56% | 33.33% |
| Profit Margin (Latest) ⓘ | 15.29% | 7.14% |
| Free Cash Flow (Latest) ⓘ | $1.14B | |
Momentum (Price trend) | ||
| 3Y Return ⓘ | +47.68% | +45.48% |
| 12M Return (excl. last month) ⓘ | +24.30% | +23.48% |
| 6M Return ⓘ | -6.62% | +20.93% |
| Price vs. 200-Day MA ⓘ | -1.98% | +7.43% |
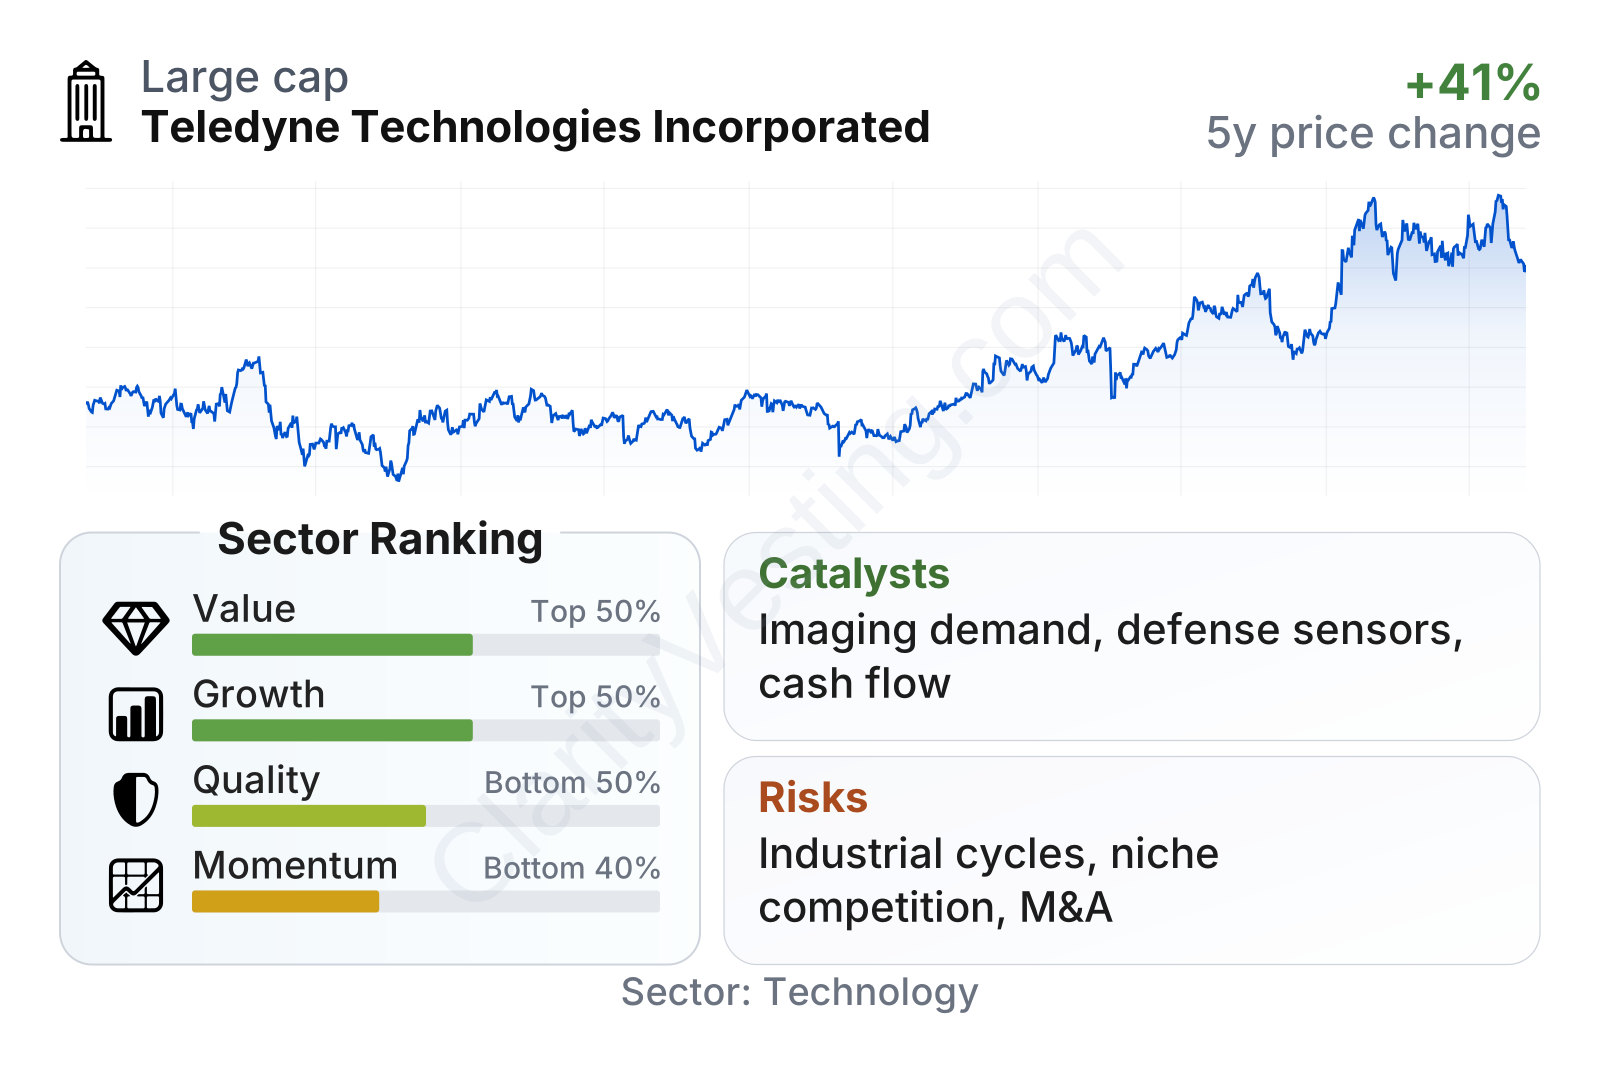
Teledyne is a large company in scientific and technical instruments, with a stock volatility level slightly below the broader market. The overall profile is mixed in a constructive way: valuation and growth indicators sit around the upper half of the sector, momentum is also in the upper half, while quality ranks lower mainly because returns on invested capital are only moderate and debt relative to operating earnings is still above the sector median. At the same time, operating margin near 20% and profit margin around 15% are clearly stronger than many peers, and free cash flow remains solid at a little above $1.1 billion on a trailing basis.
The stock price trend has also been notable. After a weak stretch in 2022 and part of 2023, the shares recovered strongly through 2024 and 2025 and remained near elevated levels in 2026. That rebound appears tied more to improving business execution and earnings quality than to a sudden speculative re-rating.
Growth
Teledyne operates in markets that generally benefit from durable long-term demand drivers: industrial automation, advanced sensing, machine vision, environmental monitoring, defense electronics, marine instrumentation, and high-end imaging. These are not all fast-growing sectors every year, but many of them are structurally supported by automation, security needs, electrification, stricter quality control, and the rising use of data-rich inspection tools.
A key part of Teledyne’s strategy is to focus on niche positions where performance matters more than volume. That makes sense for future growth because it can reduce direct price competition. It also allows the company to sell into industries where switching costs are meaningful. A defense platform, laboratory workflow, industrial inspection line, or medical imaging system is not easily redesigned around a cheaper part if the existing component is already qualified and trusted.
Recent revenue growth has improved again after a softer patch in 2024. Year-over-year sales expansion moved back into the high-single-digit range by early 2026, which is a healthier pace than the prior slowdown. The pattern suggests the business was not facing a structural decline, but rather uneven demand across end markets before growth reaccelerated.
Cash generation is another important growth signal. Free cash flow expanded sharply from 2022 levels and has stayed above $1.0 billion recently. That matters because it gives Teledyne room to keep funding research, pursue acquisitions, reduce debt, and support capacity in technical product lines without relying too heavily on external financing.
One of the clearest catalysts is imaging. Teledyne has built a broad portfolio spanning industrial vision, infrared, space sensors, and healthcare-related imaging components. Demand for machine vision and inspection tools can rise as factories automate more tasks and require higher precision. Defense and space exposure can also support demand for specialized sensors where qualification barriers are high.
Another catalyst is portfolio shaping. Teledyne has a long history of acquisitions, and the company has often used them to deepen positions in fragmented technical niches. When this is done with discipline, it can add products, cross-selling opportunities, and engineering capabilities faster than building everything internally.
Recent company communications have also pointed to continued order activity and demand support in several specialized markets, including marine instrumentation, defense electronics, and digital imaging. None of these alone transforms the company overnight, but together they reinforce the case that Teledyne is positioned in areas with continuing technical spending rather than short-lived consumer demand cycles.
Risks
This article is for informational purposes only and does not constitute financial advice. Some content is AI-generated. See Disclaimer


