Stock Analysis · Skyline Corporation (SKY)
Overview
Skyline Corporation is a U.S. homebuilder focused on residential construction. The company develops communities, acquires and improves land, builds single-family homes and townhomes, and sells those homes to buyers across a number of regional markets. In simple terms, it makes money by turning land, materials, and labor into completed homes and then selling them.
Its business is tied closely to the housing market, especially demand for new homes, mortgage affordability, local population growth, and the availability of finished lots. Skyline has also expanded its footprint through acquisitions over time, which has helped it enter new markets and broaden its community base.
The main revenue source is overwhelmingly home sales. Based on recent annual filings, the revenue mix appears to be concentrated as follows:
- Homebuilding and home sales: approximately 95% to 98% of revenue. This includes sales of completed homes, homes under construction, and related lot premiums and upgrades.
- Land sales and other real estate-related activity: approximately 1% to 3% of revenue. This can include sales of undeveloped or excess land and occasional transactions tied to community development.
- Financial services and other: generally a small low-single-share portion when disclosed, including title, mortgage-related, or other ancillary activity depending on the period and presentation.
That concentration is important: Skyline is essentially a direct play on U.S. new-home demand rather than a diversified conglomerate. The business model can be very profitable when pricing, build pace, and land discipline line up well, but results can also move sharply when housing conditions weaken.
Revenue and profit flow have been cyclical rather than steadily linear. Over the last several years, the company moved from a very strong profitability phase into a reset and then partial recovery, which is typical for homebuilders when interest rates and affordability shift. Even so, cash generation has remained meaningful and the balance sheet has stayed conservative.
The visual flow of revenue to profit highlights that gross profit and net income remain positive, but margins are well below the unusually strong levels reached earlier in the cycle. Selling and administrative costs have also taken a larger share of revenue than during the peak period, which helps explain why earnings have normalized.
Key Figures
| Metric | Value | Sector ⓘ |
|---|---|---|
| Date | Sep 12, 2026 | |
| Context | ||
| Sector | Consumer Cyclical | |
| Industry | Residential Construction | |
| Market Cap ⓘ | $4.44B | |
| Beta ⓘ | 1.01 | |
Value (Cheapness) | ||
| P/E Ratio ⓘ | 24.33 | 17.10 |
| FCF Yield ⓘ | 5.99% | 8.53% |
| EBIT / EV ⓘ | 6.79% | 6.46% |
| PEG ⓘ | N/A | |
Growth (Business expansion) | ||
| Revenue Growth ⓘ | 1.30% | 5.75% |
| RPS Growth (5Y CAGR) ⓘ | 5.17% | 9.14% |
| EPS Growth (5Y CAGR) ⓘ | -47.15% | -18.21% |
| Margin Growth (5Y Trend) ⓘ | -4.68% | -0.23% |
| FCF Growth (5Y CAGR) ⓘ | 8.80% | 4.91% |
Quality (Business durability) | ||
| ROIC (Latest) ⓘ | 12.03% | 12.61% |
| ROIC (5Y Median) ⓘ | 13.06% | 10.72% |
| Net Debt / EBIT (Latest) ⓘ | -2.52 | 2.10 |
| Net Debt / EBIT (5Y Median) ⓘ | -1.66 | 2.32 |
| Operating Margin (Latest) ⓘ | 9.81% | 9.25% |
| Operating Margin (5Y Median) ⓘ | 10.70% | 9.64% |
| Debt to Equity (Latest) ⓘ | 7.83% | 75.78% |
| Profit Margin (Latest) ⓘ | 7.16% | 5.33% |
| Free Cash Flow (Latest) ⓘ | $265.99M | |
Momentum (Price trend) | ||
| 3Y Return ⓘ | +19.19% | +14.53% |
| 12M Return (excl. last month) ⓘ | +33.96% | +3.08% |
| 6M Return ⓘ | +7.07% | +0.55% |
| Price vs. 200-Day MA ⓘ | +0.03% | -0.54% |
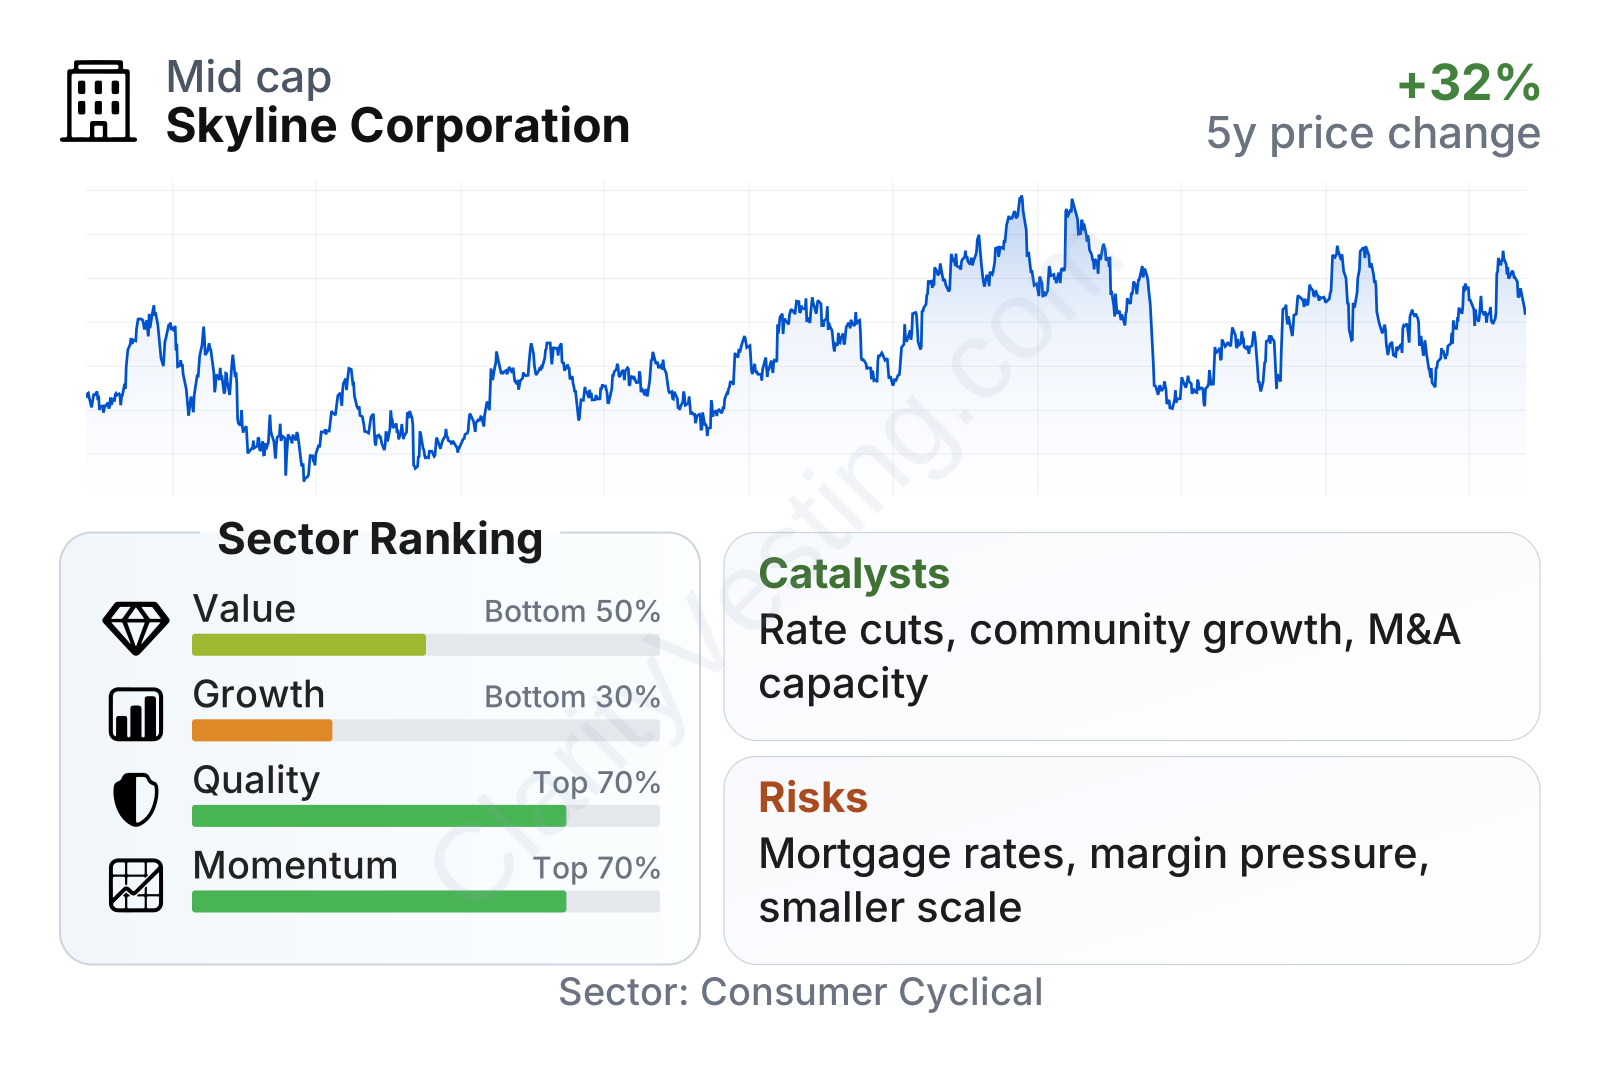
Skyline is a mid-sized public homebuilder with a market value a little above $5 billion, and its share-price volatility has been close to the broader market, as shown by a beta near 1.0. The broader picture is mixed. Quality measures look solid: returns on invested capital are slightly above the sector median, operating profitability is modestly better than peers, and leverage is far lower than most companies in the same industry. The company also stands out for having net cash rather than net debt on an earnings basis.
The weaker area is growth. Recent revenue growth has slowed to around 1%, clearly below the sector median, and longer-term revenue-per-share and earnings-per-share trends over five years remain negative. Value metrics are also not especially cheap relative to peers, with a P/E above the sector median and free cash flow yield below the industry midpoint. On the other hand, market momentum has been strong over the last several years, suggesting the market has rewarded Skyline’s balance-sheet strength and operating resilience despite slower fundamental growth.
Growth
Skyline operates in residential construction, a sector that benefits over time from population growth, household formation, limited housing supply in many U.S. markets, and the aging of the existing housing stock. Those are supportive long-term industry drivers. At the same time, homebuilding is highly cyclical, so even a structurally healthy sector can experience sharp slowdowns when mortgage rates rise or affordability tightens.
Skyline’s strategy still makes sense for future growth because scale matters in homebuilding. Builders with established land positions, local market knowledge, supplier relationships, and disciplined capital allocation usually have an advantage when smaller competitors struggle. The company’s historically conservative balance sheet gives it flexibility to keep buying land, opening communities, or pursuing acquisitions when opportunities appear.
Revenue growth has been volatile. Skyline posted very strong expansion during the earlier housing upcycle, then moved through a period of contraction, followed by recovery and a more recent slowdown to low-single-digit growth. That pattern suggests the business is currently in a normalization phase rather than a clean acceleration phase. For long-term analysis, the main question is not whether quarterly growth is smooth, but whether the company can keep converting land inventory into profitable closings across multiple years.
Cash generation is one of the more encouraging parts of the picture. Free cash flow has remained positive and has improved from the lower point seen in 2024, reaching roughly the upper-$200 million range on a trailing basis. In a land-intensive business, positive free cash flow matters because it can support land investment, acquisitions, buybacks, or simply preserve financial flexibility during a softer housing environment.
Recent company communications and filings have emphasized community count expansion, market positioning in attractive geographies, and the use of incentives and product mix adjustments to maintain sales pace. If mortgage rates stabilize or decline, that could improve affordability and act as a meaningful catalyst for order growth. Another potential opportunity is industry consolidation: well-capitalized builders can gain share when weaker competitors pull back on land spending or new community openings.
Risks
This article is for informational purposes only and does not constitute financial advice. Some content is AI-generated. See Disclaimer


