Stock Analysis · Sinclair Broadcast Group Inc (SBGI)
Overview
Sinclair Broadcast Group Inc. is a U.S. media company best known for owning and operating local television stations. Through those stations, it sells advertising, distributes local news and syndicated programming, and earns fees from cable, satellite, and virtual pay-TV providers that carry its channels. Sinclair also has smaller businesses tied to content distribution, digital media, and tennis-related sports assets.
For a long-term view, the key point is that Sinclair is still primarily a local broadcasting company, even though it has tried to broaden its footprint beyond traditional TV. Its business is shaped by two big forces: the resilience of local news and retransmission fees on one side, and the long-term pressure from cord-cutting and changing advertising habits on the other.
Based on recent company reporting, Sinclair’s main revenue sources can be summarized as follows:
- Distribution revenue: about 45% to 50% — fees paid by cable, satellite, and streaming bundle providers to carry Sinclair’s local broadcast stations.
- Advertising revenue: about 35% to 40% — mainly local and national ad sales on TV stations. This category tends to swing with the economy and with political advertising cycles.
- Political advertising: highly variable, often 0% to 10%+ — election years can create a meaningful temporary boost, especially in local TV markets.
- Content and other media revenue: about 10% to 15% — includes non-core media activities and other operating revenue sources outside the main station advertising and carriage-fee model.
That mix matters because distribution revenue is usually steadier than advertising, while advertising can be much more cyclical. It also means headline growth can look stronger in election years and weaker in off-cycle periods, so a single year rarely tells the full picture.
The broader flow of the business shows a company that can still generate solid gross profit, but where interest expense remains a major claim on earnings. Revenue has also been uneven in recent years, reflecting both the political advertising cycle and structural pressure in legacy television.
One visible pattern is that profitability has not moved in a straight line. Revenue rebounded in 2024, then softened again in 2025, while interest costs stayed heavy. That makes cash generation and debt management more important than headline sales alone.
Key Figures
| Metric | Value | Sector ⓘ |
|---|---|---|
| Date | Sep 12, 2026 | |
| Context | ||
| Sector | Communication Services | |
| Industry | Broadcasting | |
| Market Cap ⓘ | $1.00B | |
| Beta ⓘ | 1.04 | |
Value (Cheapness) | ||
| P/E Ratio ⓘ | 17.59 | 18.61 |
| FCF Yield ⓘ | 9.47% | 13.68% |
| EBIT / EV ⓘ | 9.00% | 4.54% |
| PEG ⓘ | 0.89 | |
Growth (Business expansion) | ||
| Revenue Growth ⓘ | 7.10% | 5.40% |
| RPS Growth (5Y CAGR) ⓘ | -13.46% | 4.62% |
| EPS Growth (5Y CAGR) ⓘ | -21.82% | -18.01% |
| Margin Growth (5Y Trend) ⓘ | 6.89% | 1.10% |
| FCF Growth (5Y CAGR) ⓘ | -17.40% | 5.88% |
Quality (Business durability) | ||
| ROIC (Latest) ⓘ | 1.02% | 8.38% |
| ROIC (5Y Median) ⓘ | 3.96% | 8.32% |
| Net Debt / EBIT (Latest) ⓘ | 8.69 | 1.99 |
| Net Debt / EBIT (5Y Median) ⓘ | 10.40 | 2.94 |
| Operating Margin (Latest) ⓘ | 12.68% | 14.89% |
| Operating Margin (5Y Median) ⓘ | 7.64% | 12.96% |
| Debt to Equity (Latest) ⓘ | 1103.16% | 59.59% |
| Profit Margin (Latest) ⓘ | 1.60% | 8.77% |
| Free Cash Flow (Latest) ⓘ | $95.00M | |
Momentum (Price trend) | ||
| 3Y Return ⓘ | +45.00% | +46.64% |
| 12M Return (excl. last month) ⓘ | -0.70% | +2.16% |
| 6M Return ⓘ | +4.04% | +5.05% |
| Price vs. 200-Day MA ⓘ | -0.87% | +2.88% |
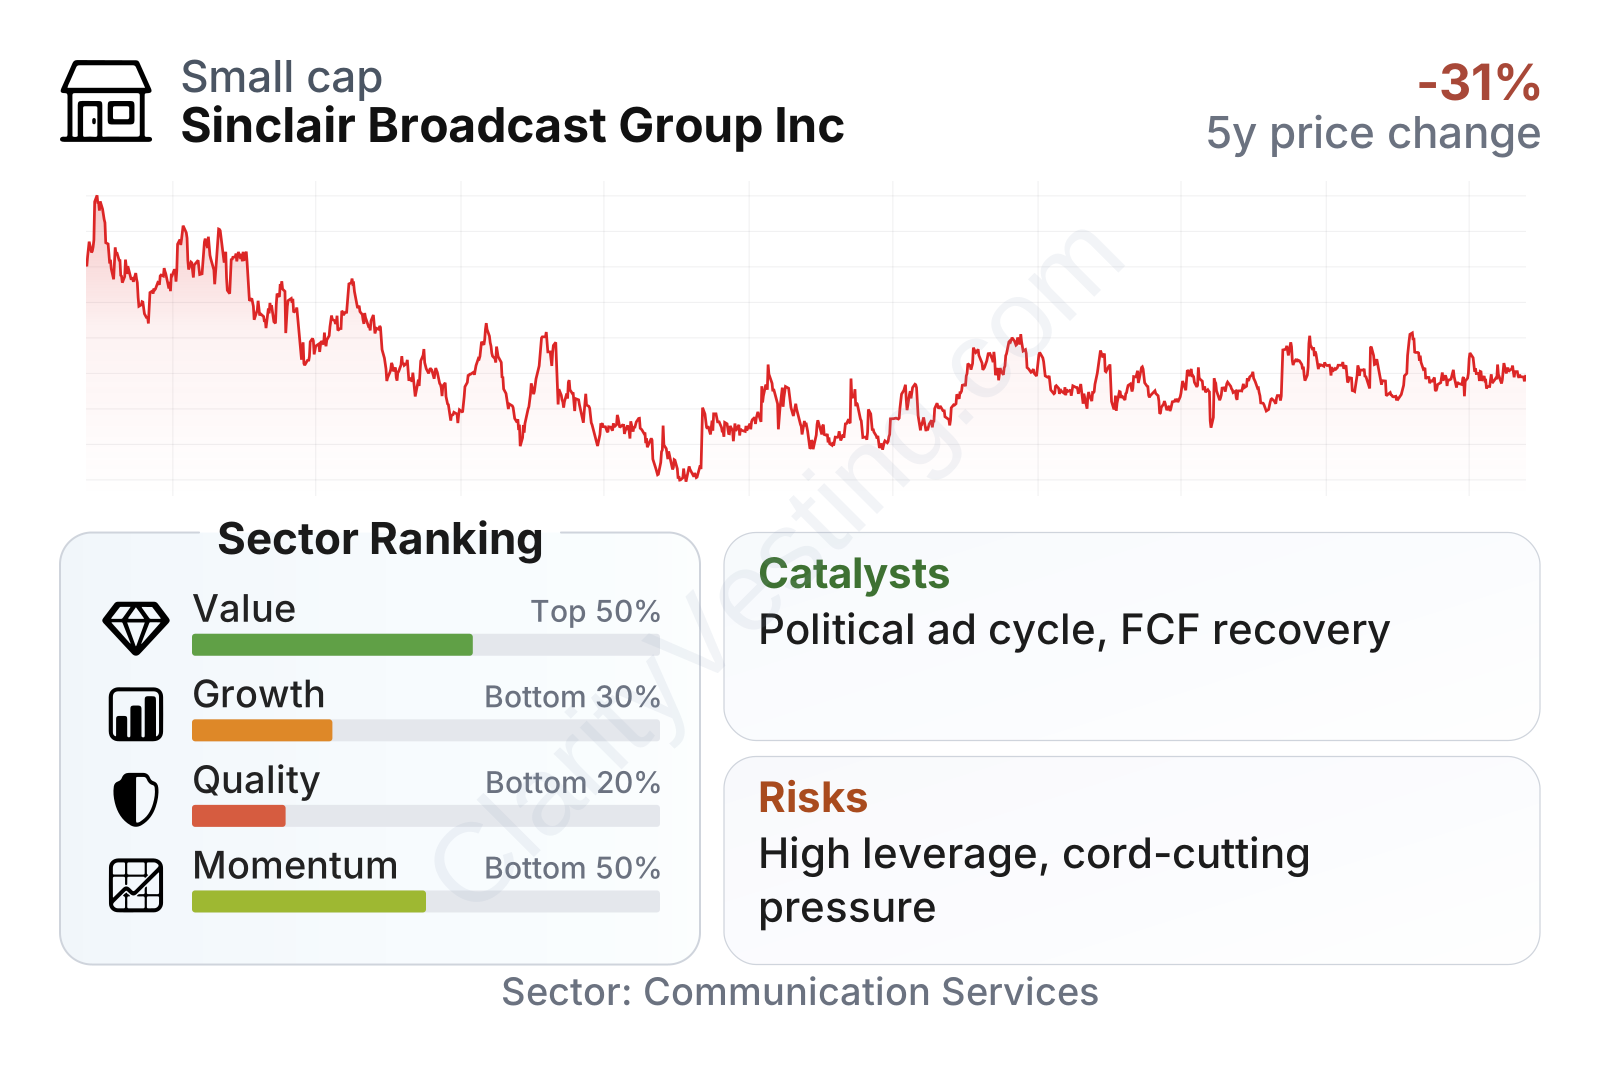
Sinclair is currently a small-cap company with a stock market value around $1 billion and a beta close to 1, which suggests share-price volatility broadly in line with the market. On valuation metrics, the stock sits near the sector median on earnings, while enterprise-value-based earnings measures look stronger than many peers. The weaker side of the profile is quality: returns on invested capital are low, leverage is very high, and profitability trails the typical company in the sector. Growth indicators are mixed, with recent year-over-year revenue improvement but a weak five-year record for revenue, earnings, and free cash flow.
Growth
Sinclair operates in a sector that is not a straightforward growth market. Traditional broadcasting faces secular pressure as viewers continue moving from cable bundles to streaming platforms. However, local television has proved more durable than many other legacy media categories because local news, sports rights, and political advertising still attract audiences and advertisers. That gives Sinclair a business with ongoing relevance, but not one with an easy industry tailwind.
The company’s strategy for future growth has centered on protecting the cash flows of its local station portfolio, increasing the value of distribution agreements, and developing adjacent assets in sports and digital distribution. In practice, this is more of a cash-harvesting and selective-expansion model than a high-growth transformation. For long-term analysis, that can still work if station cash flows remain durable enough to support debt reduction and if newer assets add resilience over time.
Recent revenue trends show how cyclical this business can be. After a sharp decline during weaker political and advertising periods, revenue returned to positive year-over-year growth in 2024 and remained modestly positive in early 2026. That rebound is encouraging, but the longer five-year picture remains much weaker than the sector median, so the central question is whether recent stabilization can turn into a more durable trend.
Free cash flow is especially important here because it shows how much cash remains after operating needs and capital spending. Sinclair’s recent pattern points to a steep drop from earlier highs, followed by some recovery. That recovery matters because for a leveraged broadcaster, cash generation is one of the few practical ways to improve flexibility, reduce debt pressure, and support the business through softer advertising cycles.
A meaningful catalyst for Sinclair is the next political advertising cycle. Local broadcasters typically benefit when election spending rises, and Sinclair’s station footprint gives it exposure to that pattern. Another catalyst is any continued improvement in distribution economics, including contract renewals that preserve carriage fees better than investors feared. If management can combine those tailwinds with further stabilization in core advertising, the earnings profile could look materially better than it did during weaker years.
Recent company updates have also highlighted ongoing efforts around content distribution and sports-related assets. Those initiatives are not yet large enough to redefine the company, but they could help diversify revenue modestly over time if execution improves.
Risks
This article is for informational purposes only and does not constitute financial advice. Some content is AI-generated. See Disclaimer


