Stock Analysis · Science Applications International Corporation (SAIC)
Overview
Science Applications International Corporation, or SAIC, is a U.S. government services contractor focused on technology-heavy work rather than consumer software or hardware. The company helps federal agencies and military customers run large and complex programs in areas such as defense, intelligence, civilian government operations, digital modernization, cybersecurity, engineering, logistics, and mission support. In simple terms, SAIC is paid to help government customers operate critical systems, modernize older technology, protect networks, and support large operational programs.
Its business is concentrated in the United States and is heavily tied to federal spending. SAIC reports its activity through two main customer groups, which are the clearest way to understand where revenue comes from.
- Defense and Intelligence — about 76% of fiscal 2026 revenue: services for the Department of Defense, intelligence agencies, space-related missions, engineering, IT modernization, mission operations, logistics, training, and secure systems support.
- Civilian — about 24% of fiscal 2026 revenue: technology and operational support for civilian federal agencies, including digital transformation, enterprise IT, cybersecurity, and program support.
Within those categories, a large share of revenue comes from long-term contracts and task orders, which gives the business more visibility than a typical project-based technology company. The trade-off is that growth depends on winning, renewing, and expanding government contracts. The company’s cost structure also shows the character of the business clearly: revenue is large, but most of it is passed through labor and delivery costs, leaving moderate operating margins. Over the last five fiscal years, annual revenue stayed around the low-to-mid $7 billion range, while operating income and net income moved more than sales did, showing that execution and contract mix matter as much as top-line growth.
SAIC’s overall profile is that of a mid-sized government technology contractor with a broad federal customer base, recurring program work, and a business model built more on reliability and contract execution than on breakthrough product sales.
Key Figures
| Metric | Value | Sector ⓘ |
|---|---|---|
| Date | Sep 12, 2026 | |
| Context | ||
| Sector | Technology | |
| Industry | Information Technology Services | |
| Market Cap ⓘ | $5.39B | |
| Beta ⓘ | 0.30 | |
Value (Cheapness) | ||
| P/E Ratio ⓘ | 14.73 | 29.51 |
| FCF Yield ⓘ | 11.47% | 4.25% |
| EBIT / EV ⓘ | 7.31% | 2.85% |
| PEG ⓘ | 3.67 | |
Growth (Business expansion) | ||
| Revenue Growth ⓘ | 6.30% | 15.40% |
| RPS Growth (5Y CAGR) ⓘ | 5.25% | 8.56% |
| EPS Growth (5Y CAGR) ⓘ | -5.38% | -11.88% |
| Margin Growth (5Y Trend) ⓘ | 0.79% | 0.46% |
| FCF Growth (5Y CAGR) ⓘ | 4.60% | 9.80% |
Quality (Business durability) | ||
| ROIC (Latest) ⓘ | 13.48% | 9.44% |
| ROIC (5Y Median) ⓘ | 12.49% | 8.30% |
| Net Debt / EBIT (Latest) ⓘ | 4.41 | 0.54 |
| Net Debt / EBIT (5Y Median) ⓘ | 4.90 | 0.44 |
| Operating Margin (Latest) ⓘ | 7.98% | 9.58% |
| Operating Margin (5Y Median) ⓘ | 7.05% | 8.25% |
| Debt to Equity (Latest) ⓘ | 188.37% | 33.33% |
| Profit Margin (Latest) ⓘ | 5.13% | 7.14% |
| Free Cash Flow (Latest) ⓘ | $619.00M | |
Momentum (Price trend) | ||
| 3Y Return ⓘ | +21.34% | +45.48% |
| 12M Return (excl. last month) ⓘ | +9.29% | +23.48% |
| 6M Return ⓘ | +42.92% | +20.93% |
| Price vs. 200-Day MA ⓘ | +24.51% | +7.43% |
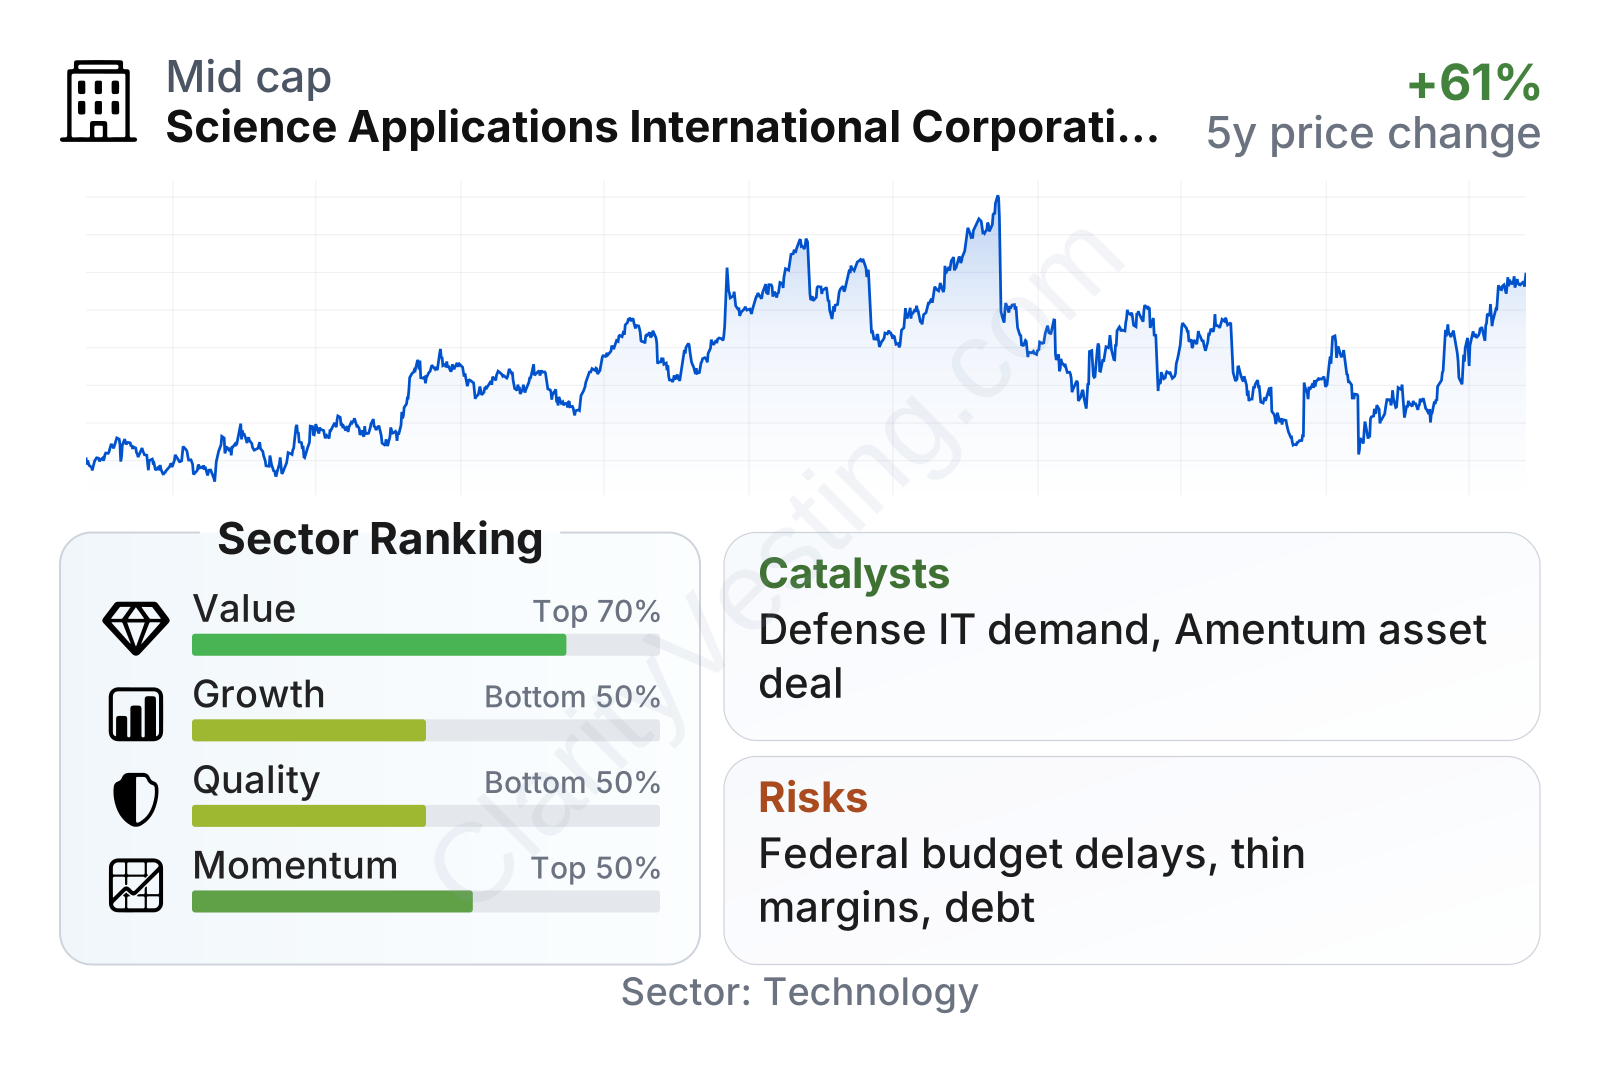
SAIC stands out more for cash generation and valuation than for rapid expansion. Its market value places it in the mid-cap range, and its share price has been much less volatile than the broader technology sector, reflected in a very low beta. On valuation measures, the company trades at a noticeably lower earnings multiple than the sector median, while free cash flow yield and EBIT relative to enterprise value are stronger than many peers. Growth indicators are less impressive: revenue growth is positive but below the sector median, and five-year revenue and free cash flow growth have been moderate rather than fast. Quality is mixed. Return on invested capital is solid, but margins remain below the sector median and leverage measured against EBIT is elevated.
Growth
SAIC operates in parts of the market that should remain relevant for years: defense technology, cyber defense, cloud migration, data-driven operations, and modernization of aging federal systems. These are not short-lived themes. Governments are trying to upgrade networks, automate workflows, improve resilience, and support more software-intensive military and intelligence missions. That creates steady demand for contractors able to work inside classified, regulated, and large-scale government environments.
The company’s strategy also fits that backdrop. SAIC has emphasized mission IT, enterprise modernization, digital engineering, and higher-value solutions instead of relying only on lower-margin staffing-style work. That direction makes sense because federal customers increasingly want integrated services combining software, cyber, cloud, and operational support. SAIC is not the only company targeting those areas, but it already has established customer relationships and the security-cleared workforce needed to compete for them.
Recent revenue growth has been uneven, which is common in government contracting because timing depends on award decisions, contract transitions, protests, and program ramps. The pattern has included periods of decline followed by a recovery into positive growth again. That does not point to a straight-line expansion profile, but it does suggest the business still has the ability to regain momentum when awards start converting into revenue.
Free cash flow is one of the more encouraging parts of the picture. Cash generation has improved from earlier levels and is now comfortably above where it was a few years ago, even though reported revenue has not surged. That matters because it shows SAIC can still turn a relatively stable contract base into meaningful cash, which supports debt management, repurchases, and general financial flexibility.
One recent strategic development is SAIC’s agreement to acquire Amentum’s logistics and supply chain management business, announced in 2026. That transaction is aimed at strengthening SAIC’s position in mission support and sustainment work for government customers. If integrated well, it could deepen customer relationships and add scale in programs that are important to defense and federal operations. More broadly, management has continued to highlight a large pipeline of bids and a focus on contracts tied to national security and modernization priorities, which remain central federal spending themes.
Risks
This article is for informational purposes only and does not constitute financial advice. Some content is AI-generated. See Disclaimer


