Stock Analysis · Rush Enterprises B Inc (RUSHB)
Overview
Rush Enterprises is one of the largest commercial vehicle dealership groups in North America. The company mainly sells new and used heavy-duty and medium-duty trucks, especially through its long-standing relationship with PACCAR’s Peterbilt brand, and it also operates a large network of service, parts, body shop, leasing, and insurance-related activities. In simple terms, Rush helps trucking fleets and other commercial customers buy vehicles, keep them running, and replace them over time.
That business mix matters because truck dealerships are not driven only by one-time vehicle sales. New truck sales are important, but service and parts often provide steadier profits, especially when freight markets soften and customers delay equipment purchases. Rush has spent years building a broad aftersales platform, which helps reduce some of the usual ups and downs of the commercial vehicle cycle.
Based on company reporting, revenue is primarily generated from the following activities, with approximate weight ranked from largest to smallest:
- New commercial vehicle sales: typically the largest contributor, often around 55% to 65% of total revenue depending on the truck cycle.
- Parts, service, and body shop: usually around 20% to 30% combined, and often the most resilient and profitable area.
- Used vehicle sales: often around 8% to 12% of revenue, though this can move with fleet replacement trends and used pricing.
- Finance and insurance, leasing, and rental: generally a smaller contributor, often in the low single digits to high single digits combined.
Over the last several years, the company expanded revenue meaningfully from the 2021 level to a peak in 2023, but profitability has moderated since then. Gross profit remains substantial, yet operating income and net income have come down from the cycle high as truck demand normalized and costs stayed elevated. That pattern fits the nature of a dealership business: large sales volumes, modest margins, and earnings that can swing with industry conditions.
Key Figures
| Metric | Value | Sector ⓘ |
|---|---|---|
| Date | Sep 12, 2026 | |
| Context | ||
| Sector | Consumer Cyclical | |
| Industry | Auto & Truck Dealerships | |
| Market Cap ⓘ | $5.82B | |
| Beta ⓘ | 0.88 | |
Value (Cheapness) | ||
| P/E Ratio ⓘ | 22.57 | 17.10 |
| FCF Yield ⓘ | 2.15% | 8.53% |
| EBIT / EV ⓘ | 5.39% | 6.46% |
| PEG ⓘ | 2.74 | |
Growth (Business expansion) | ||
| Revenue Growth ⓘ | -1.60% | 5.75% |
| RPS Growth (5Y CAGR) ⓘ | 0.99% | 9.14% |
| EPS Growth (5Y CAGR) ⓘ | -24.34% | -18.21% |
| Margin Growth (5Y Trend) ⓘ | -0.70% | -0.23% |
| FCF Growth (5Y CAGR) ⓘ | 22.43% | 4.91% |
Quality (Business durability) | ||
| ROIC (Latest) ⓘ | 8.41% | 12.61% |
| ROIC (5Y Median) ⓘ | 10.21% | 10.72% |
| Net Debt / EBIT (Latest) ⓘ | 3.30 | 2.10 |
| Net Debt / EBIT (5Y Median) ⓘ | 3.21 | 2.32 |
| Operating Margin (Latest) ⓘ | 5.12% | 9.25% |
| Operating Margin (5Y Median) ⓘ | 6.02% | 9.64% |
| Debt to Equity (Latest) ⓘ | 63.70% | 75.78% |
| Profit Margin (Latest) ⓘ | 3.67% | 5.33% |
| Free Cash Flow (Latest) ⓘ | $125.47M | |
Momentum (Price trend) | ||
| 3Y Return ⓘ | +79.30% | +14.53% |
| 12M Return (excl. last month) ⓘ | +37.03% | +3.08% |
| 6M Return ⓘ | +26.12% | +0.55% |
| Price vs. 200-Day MA ⓘ | +11.64% | -0.54% |
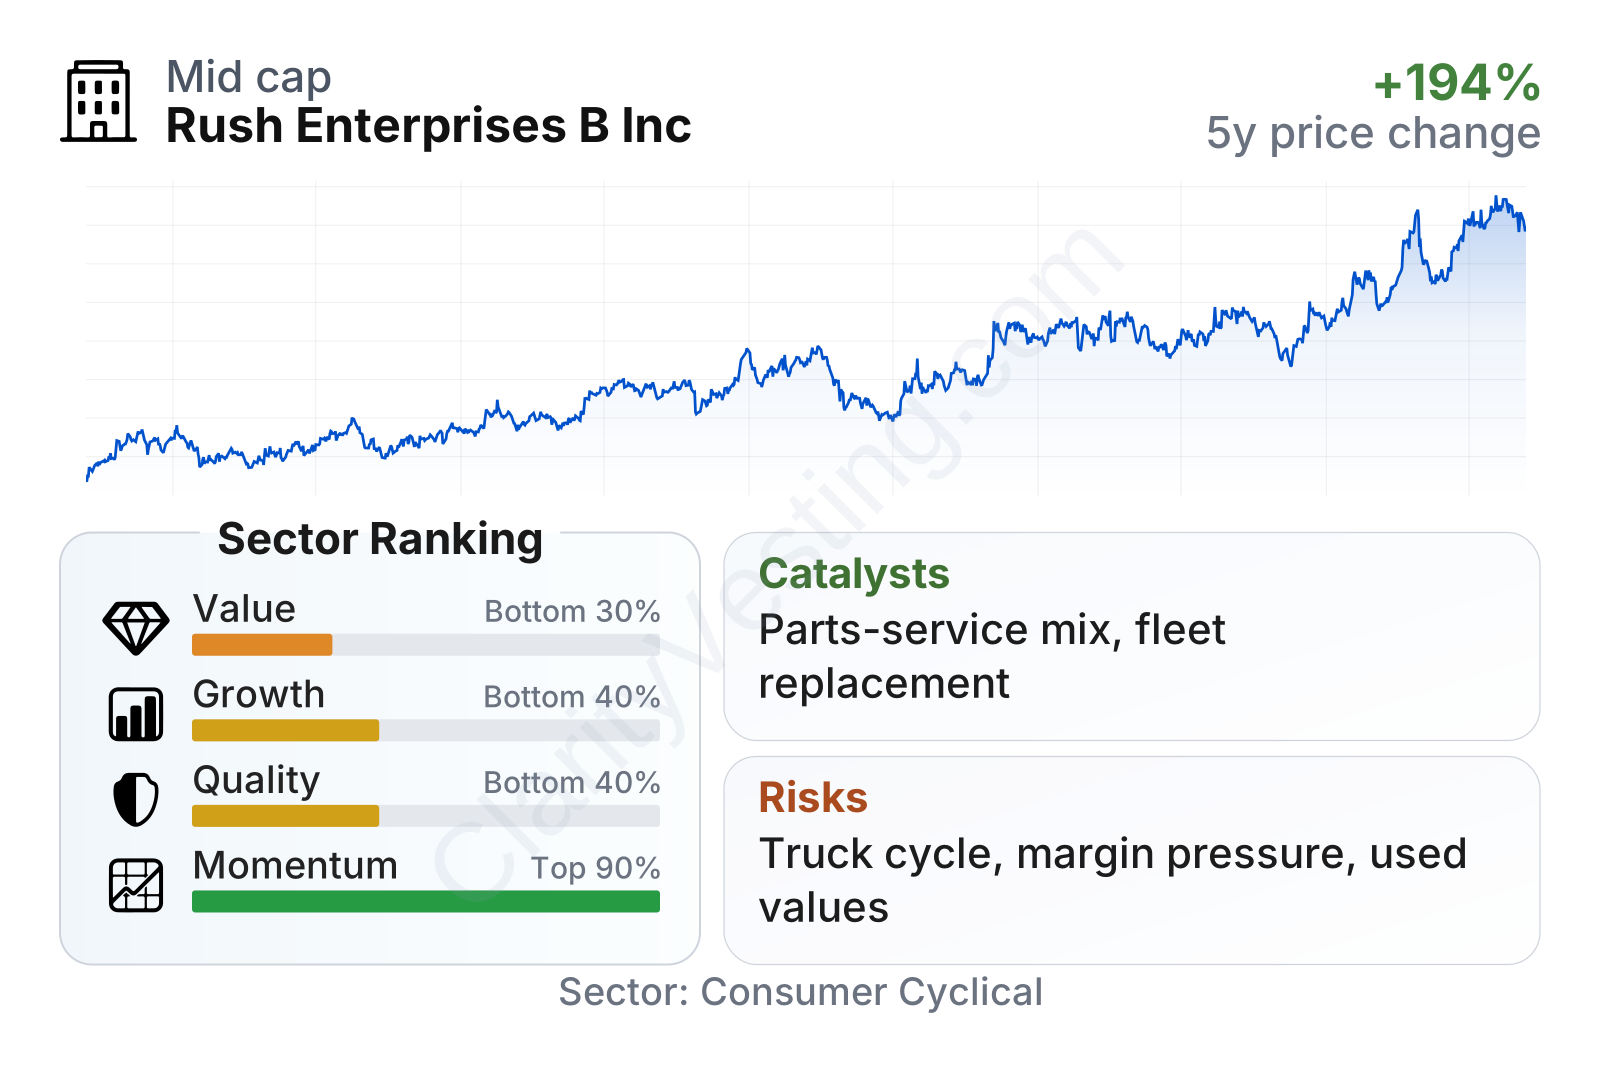
Rush Enterprises currently sits in a mid-cap range, with a market value of roughly $5.6 billion, and its share price volatility has been somewhat lower than the broader market, as suggested by a beta below 1. The stock’s market performance has been strong over the past several years, clearly ahead of much of its sector, but the underlying business metrics are more mixed.
The overall picture from the latest measures is that market momentum looks strong, while value, growth, and quality rank in the lower part of the sector. That combination usually means the share price has held up well even as the operating backdrop became less favorable. Profitability and returns remain positive, but they are not especially high relative to peers, and leverage measured against earnings is somewhat heavier than the sector median.
Growth
Rush operates in a sector that should remain relevant for a long time because freight transportation, infrastructure activity, construction, and logistics all require commercial vehicles and ongoing maintenance. Over time, that creates recurring demand not only for trucks, but also for replacement parts, repairs, and fleet support. This is not a high-growth technology market, but it can still produce durable growth for well-positioned operators with scale, strong customer relationships, and a large service footprint.
The company’s strategy makes sense in that context. Rush is not trying to depend only on truck sales volume. It has built a broad dealership and service network across the U.S. and Canada, with a focus on parts and service revenue that can help stabilize results across the cycle. That is especially important as fleets keep vehicles longer during weaker freight conditions, because older trucks typically need more maintenance and replacement parts.
Recent revenue growth has clearly cooled. After very strong gains in 2022 and continued expansion in 2023, sales turned negative year over year through much of 2024 and into 2026. That suggests the company is now moving through a softer point in the truck demand cycle rather than a period of broad-based expansion. For long-term analysis, the key question is whether the business can continue widening its higher-quality aftersales base while waiting for vehicle demand to recover.
Cash generation has been volatile, which is common for dealerships because inventory and working capital can move sharply from year to year. Even so, free cash flow has recovered from a weak 2024 and remains positive on a trailing basis. The stronger five-year cash flow growth trend is better than the revenue and earnings trend, which suggests management has had some success converting the business into cash despite cyclical swings.
Potential catalysts for future growth include a rebound in North American truck orders, replacement demand from aging fleets, and continued expansion of service capacity. Another structural opportunity comes from the growing complexity of commercial vehicles, including emissions systems, connectivity, and alternative powertrain servicing, which can increase the value of a large professional service network. Recent company communications have continued to emphasize parts, service, and network development, which is consistent with the most durable part of the business model.
Risks
This article is for informational purposes only and does not constitute financial advice. Some content is AI-generated. See Disclaimer


