Stock Analysis · Rush Enterprises A Inc (RUSHA)
Overview
Rush Enterprises is one of the largest commercial vehicle dealership groups in North America. The company mainly sells heavy-duty and medium-duty trucks, especially through its long-standing relationship with PACCAR brands such as Peterbilt, and it also operates a large service and support network. Its business is tied to the broader freight, logistics, construction, and industrial economy because fleets, owner-operators, and businesses need trucks, maintenance, replacement parts, and related equipment to keep operating.
The company’s revenue base is diversified across vehicle sales and higher-frequency aftermarket activities. Based on recent annual reporting, the main sources of revenue are approximately:
- New commercial vehicle sales: about 58% to 62% of revenue. This includes new heavy-duty and medium-duty trucks sold through the dealership network.
- Aftermarket products and services: about 22% to 26% of revenue. This generally includes parts, service, body shop work, and maintenance activities.
- Used vehicle sales: about 9% to 12% of revenue. This comes from the resale of pre-owned trucks and other commercial vehicles.
- Leasing and rental: about 3% to 5% of revenue. This includes commercial vehicle leasing, rentals, and related support.
- Finance and insurance plus other: usually a small remaining share of revenue, supported by customer financing-related products and other dealership activities.
That mix matters because new truck sales are more cyclical, while parts and service tend to be steadier and usually carry better margins. Over the last several years, the company has grown into a broad commercial vehicle platform rather than a simple truck retailer, but revenue is still led by vehicle sales. The flow of revenue and costs shows a business with very large sales volume, relatively thin operating margins, and meaningful sensitivity to expenses and financing conditions.
Over the 2021 to 2025 period, revenue expanded strongly through 2023 and then eased, while gross profit held up better than sales. The bigger pressure point has been below gross profit: interest expense rose sharply from very low levels, and net income has trended down from the 2022 peak. That pattern fits a dealership business moving from unusually favorable market conditions back toward a more normal environment.
Key Figures
| Metric | Value | Sector ⓘ |
|---|---|---|
| Date | Jul 20, 2026 | |
| Context | ||
| Sector | Consumer Cyclical | |
| Industry | Auto & Truck Dealerships | |
| Market Cap ⓘ | $5.98B | |
| Beta ⓘ | 0.89 | |
Value (Cheapness) | ||
| P/E Ratio ⓘ | 23.23 | 18.58 |
| FCF Yield ⓘ | 3.15% | 7.99% |
| EBIT / EV ⓘ | 5.35% | 5.91% |
| PEG ⓘ | 3.16 | |
Growth (Business expansion) | ||
| Revenue Growth ⓘ | -9.00% | 5.50% |
| RPS Growth (5Y CAGR) ⓘ | 0.99% | 9.20% |
| EPS Growth (5Y CAGR) ⓘ | -41.17% | -26.43% |
| Margin Growth (5Y Trend) ⓘ | -0.70% | -0.18% |
| FCF Growth (5Y CAGR) ⓘ | 22.43% | 5.02% |
Quality (Business durability) | ||
| ROIC (Latest) ⓘ | 8.51% | 12.03% |
| ROIC (5Y Median) ⓘ | 10.21% | 10.82% |
| Net Debt / EBIT (Latest) ⓘ | 3.13 | 2.12 |
| Net Debt / EBIT (5Y Median) ⓘ | 3.21 | 2.25 |
| Operating Margin (Latest) ⓘ | 5.26% | 9.28% |
| Operating Margin (5Y Median) ⓘ | 6.02% | 9.64% |
| Debt to Equity (Latest) ⓘ | 63.28% | 75.23% |
| Profit Margin (Latest) ⓘ | 3.65% | 5.28% |
| Free Cash Flow (Latest) ⓘ | $188.29M | |
Momentum (Price trend) | ||
| 3Y Return ⓘ | +94.82% | +10.68% |
| 12M Return (excl. last month) ⓘ | +39.73% | +5.26% |
| 6M Return ⓘ | +25.74% | -2.41% |
| Price vs. 200-Day MA ⓘ | +21.84% | +1.55% |
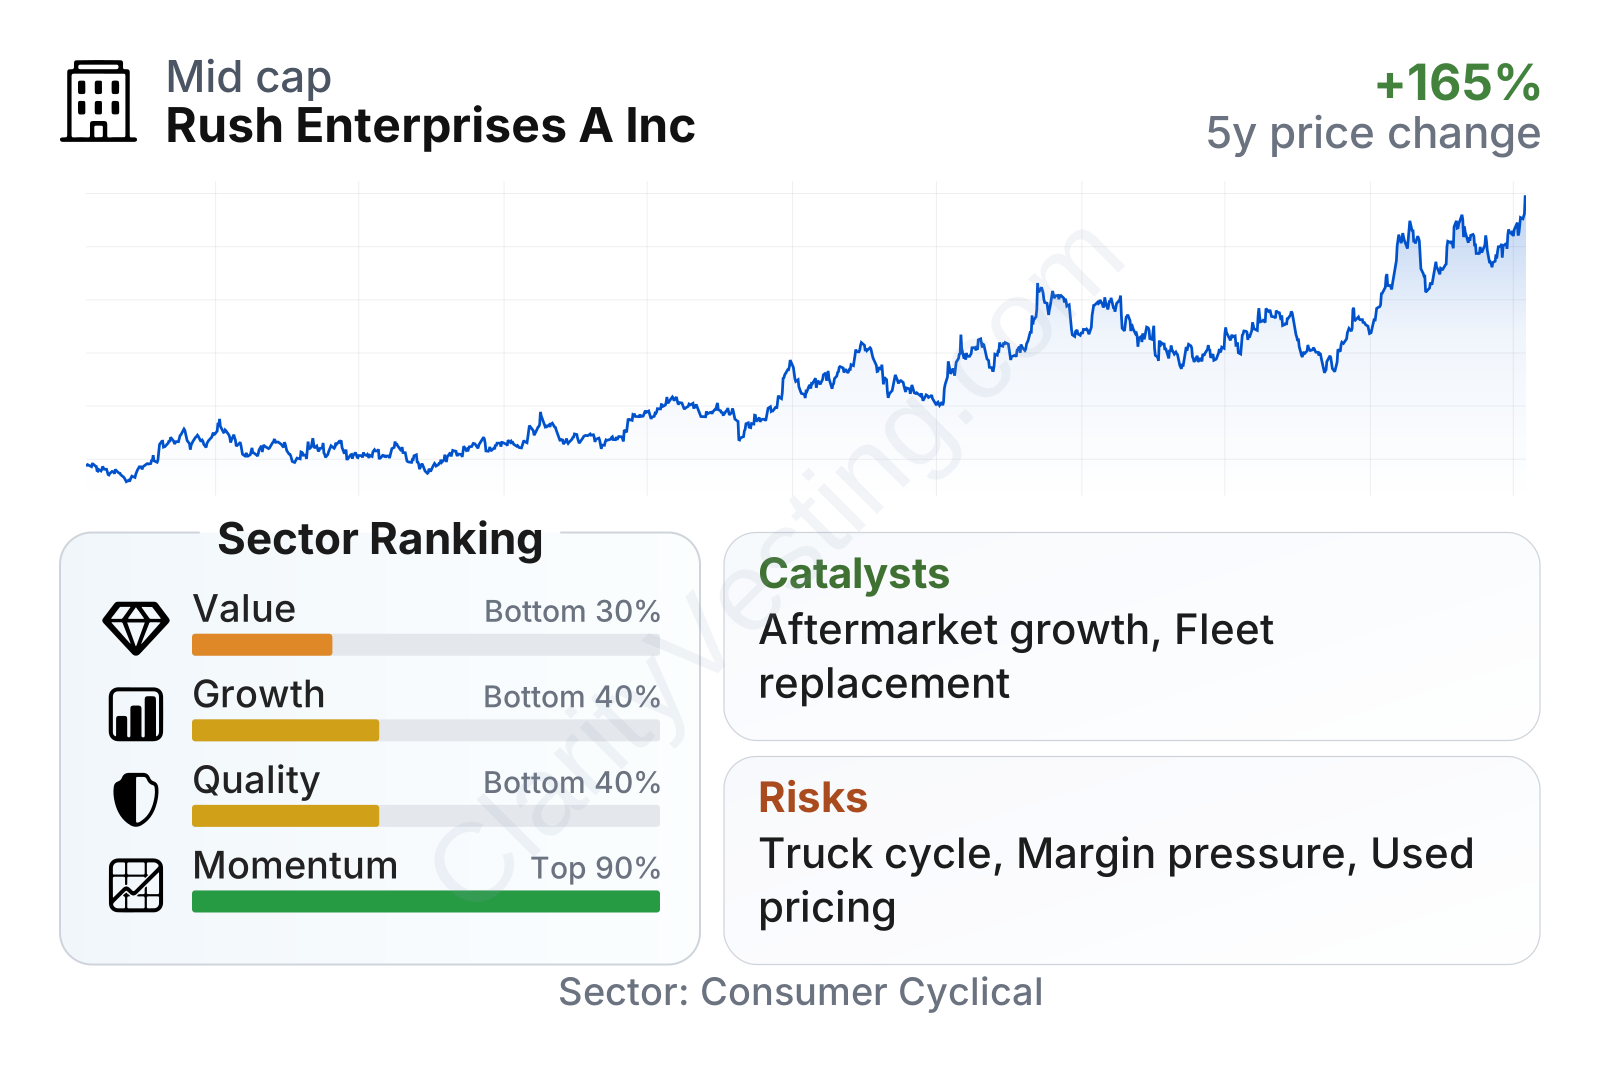
Rush Enterprises is a mid-sized public company with a market value around $6 billion and a beta below 1, which suggests its share price has historically been a bit less volatile than the overall market. The stock’s recent market performance has been strong, with returns over the last 6 months, 12 months, and 3 years running well ahead of the sector median. By contrast, the company’s current factor profile is less impressive on fundamentals: value ranks in the lower part of the sector, growth is below average, and quality is also below average, mainly because margins and returns on capital are modest for the industry.
One notable contrast stands out in the table: free cash flow has improved materially over a 5-year period even though revenue growth and earnings growth have cooled. That helps explain why the market has rewarded the stock despite softer recent operating trends.
Growth
Rush Enterprises operates in a market with long-term structural relevance rather than rapid secular expansion. Commercial trucks remain essential to freight movement, infrastructure activity, local delivery, energy, municipal services, and construction. That does not make the sector immune to downturns, but it does mean demand is supported by replacement cycles and the ongoing need to maintain working fleets. In that sense, the company is in a durable industry, even if not a high-growth one.
The company’s strategy for future expansion is sensible because it leans on scale, network density, and the less cyclical parts-and-service business. A dealership with a large installed base of trucks on the road has recurring opportunities to sell maintenance, repairs, collision work, and replacement components. Those activities can help smooth results when new truck orders slow. Rush has also continued to build its footprint and service capabilities over time, which supports customer retention and gives it more ways to earn revenue from each truck beyond the initial sale.
Recent revenue growth has clearly slowed. After a period of very strong year-over-year expansion in 2022 and a still positive 2023, the business moved into modest contraction across much of 2024 and 2025, with the latest reading still down about 9% year over year. That suggests the company is in the softer part of the cycle, likely reflecting normalization in truck demand, freight conditions, and used vehicle pricing rather than a broken business model.
Cash generation has been uneven but still meaningful. Free cash flow moved from positive levels to a negative swing and then back to a strong rebound before settling at a still positive trailing level. That volatility is common in dealership businesses because inventory, receivables, and floorplan financing can heavily affect cash movement from one period to another. Even so, staying positive on a trailing basis after a cyclical pullback is an encouraging operational signal.
A major long-term catalyst is the ongoing expansion of the aftermarket business. Parts and service revenue is linked to the population of trucks already in operation, not only to new vehicle deliveries. Another catalyst is replacement demand: aging fleets eventually need upgrades for fuel efficiency, reliability, safety, and emissions compliance. Industry evolution toward alternative powertrains, more connected vehicles, and more sophisticated maintenance requirements could also favor large dealership operators with service capacity and technical expertise.
Recent company communications have also continued to emphasize network development, customer support capabilities, and strategic acquisitions where appropriate. For a business like Rush, these are practical growth levers because market share can be gained locally and regionally even when the industry is not booming overall.
Risks
The biggest risk is cyclicality. Rush Enterprises depends heavily on commercial vehicle demand, and that demand follows freight activity, industrial production, construction trends, credit availability, and fleet profitability. When carriers delay purchases, dealership volumes and pricing power can weaken quickly. Because new truck sales still represent the majority of revenue, downturns in the sales cycle matter a great deal.
Balance sheet leverage looks manageable in simple debt-to-equity terms and is currently below the sector median, with the latest level near 63% versus roughly 87% for the median peer. That said, the company’s net debt relative to EBIT is higher than the sector median, which shows that earnings coverage of debt is less comfortable than the equity ratio alone might suggest. For a low-margin business, that is worth attention, especially in a weaker cycle.
Profitability is another important limitation. Net profit margin has moved down from the mid-5% range in 2022 to about 3.6% recently, and it has remained below the sector median throughout the period shown. Operating margin is also noticeably lower than the industry median. In practical terms, Rush is a high-revenue business that keeps only a relatively small portion of each sales dollar after costs. That makes execution, inventory control, and financing discipline especially important.
Competition is significant. Rush is a major player in commercial truck dealerships, but it does not operate in a winner-take-all market. Rivals include other dealership groups, independent commercial truck dealers, and manufacturers with strong dealer relationships. In the broader vehicle retail space, large public peers such as Penske Automotive Group, AutoNation, Lithia, Group 1 Automotive, and Sonic compete for capital and operational talent, although their business mixes differ and many are more concentrated in passenger vehicles. Within heavy-duty trucks, competition is also shaped by OEM brand strength, dealer locations, service quality, parts availability, and fleet relationships.
Rush’s competitive advantages are real but somewhat narrow. Its scale in commercial vehicles, broad geographic coverage, strong aftermarket presence, and long-term OEM ties create barriers that smaller local dealers may struggle to match. Service infrastructure can be especially valuable because downtime is costly for customers. However, the company is not insulated from pricing pressure, cyclical demand swings, or shifts in manufacturer strategy. It is a leader in commercial truck dealership scale, but not a dominant platform with exceptional margins.
No major public issue currently stands out in the form of a governance scandal or reputational crisis based on company filings and investor communications reviewed here. The more relevant near-term risks appear operational and cyclical: softer truck demand, margin normalization, used vehicle price pressure, and sensitivity to interest rates and financing costs.
Valuation
The valuation picture is less straightforward than the business model. Rush Enterprises traded for much lower earnings multiples in 2021 through 2024, generally below the sector median. More recently, the multiple has moved up sharply and now sits around 23 times earnings, above the sector median near 18 times. That is a notable re-rating for a company whose recent revenue growth is negative, margins are under pressure, and earnings growth over several years has not been especially strong.
The higher multiple may reflect confidence in the durability of the aftermarket business, improved capital allocation, stronger recent stock momentum, and expectations that the current cycle is closer to a trough than a peak. Those are understandable arguments, but they also reduce the margin for disappointment. When a cyclical dealership business is valued above the sector median while growth and profitability rank below average, the market is already giving meaningful credit for resilience and recovery.
On balance, the current price appears to embed a fairly constructive view of normalization ahead. That does not look extreme in the context of Rush’s scale and market position, but it does look more demanding than the company’s own historical range and more demanding than many sector peers on current earnings.
Conclusion
Rush Enterprises stands out as a large, well-established commercial vehicle dealership platform with a valuable parts-and-service engine, broad customer reach, and a business that remains economically important even when growth slows. The company has credible long-term strengths: scale in a specialized niche, recurring aftermarket activity, and exposure to fleet replacement needs that should persist across cycles.
The challenge is that the recent financial profile is mixed. Revenue has softened, margins have normalized downward, and leverage looks more comfortable on equity than on earnings coverage. At the same time, the stock has performed very well and now trades at a richer earnings multiple than it did through most of the last five years. That combination makes Rush look like a solid business with real operating strengths, but one whose current market valuation already assumes a good amount of durability and future recovery.
Sources:
- Rush Enterprises, Inc. — Form 10-Q for the quarter ended March 31, 2026
- Rush Enterprises, Inc. — Form 10-K for the year ended December 31, 2025
- SEC EDGAR — Rush Enterprises, Inc. filings
- Rush Enterprises Investor Relations — earnings releases and investor presentation materials
- Wikipedia — Rush Enterprises
This article is for informational purposes only and does not constitute financial advice. Some content is AI-generated. See Disclaimer