Stock Analysis · Red Rock Resorts Inc (RRR)
Overview
Red Rock Resorts is a casino and entertainment company best known for owning and operating Station Casinos properties in the Las Vegas area. Its business is centered on “locals” gaming rather than the large tourist-focused Strip market. That means the company mainly serves residents of the Las Vegas Valley through casinos that combine slot machines, table games, food and beverage, hotel rooms, bowling, movie theaters, and other entertainment. This focus makes Red Rock Resorts more tied to the health of the local economy, population growth, and recurring customer visits than to international tourism trends.
The company’s revenue comes primarily from its Las Vegas operations. Based on its recent annual reporting structure, the business is heavily concentrated in one main operating segment, with a smaller contribution from its managed and distributed operations. Within the core resort business, gaming is by far the largest source of revenue, followed by food and beverage, then rooms and other non-gaming activities.
- Casino and gaming revenue: approximately 75% to 80% of total revenue. This includes slot machines, table games, race and sports wagering, and related gaming activity.
- Food and beverage: approximately 10% to 15% of total revenue. This includes restaurants, bars, catering, and banquet services inside the resorts.
- Rooms: approximately 5% to 7% of total revenue. This covers hotel stays and related room services.
- Other revenue: approximately 4% to 8% of total revenue. This includes entertainment, bowling, retail, and other amenity-based revenue streams.
- Managed and distributed operations: a small share of total revenue, generally well below 10%, tied to route operations and management-related activities.
What stands out is the company’s operating profile: revenue has trended upward over the last several years, while operating income has remained strong even as interest expense has absorbed a larger share of earnings. That combination points to a business with solid property-level economics but meaningful financing costs.
Key Figures
| Metric | Value | Sector ⓘ |
|---|---|---|
| Date | Sep 12, 2026 | |
| Context | ||
| Sector | Consumer Cyclical | |
| Industry | Resorts & Casinos | |
| Market Cap ⓘ | $5.58B | |
| Beta ⓘ | 1.31 | |
Value (Cheapness) | ||
| P/E Ratio ⓘ | 19.46 | 17.10 |
| FCF Yield ⓘ | 9.64% | 8.53% |
| EBIT / EV ⓘ | 8.39% | 6.46% |
| PEG ⓘ | 1.69 | |
Growth (Business expansion) | ||
| Revenue Growth ⓘ | -3.00% | 5.75% |
| RPS Growth (5Y CAGR) ⓘ | 8.99% | 9.14% |
| EPS Growth (5Y CAGR) ⓘ | -22.15% | -18.21% |
| Margin Growth (5Y Trend) ⓘ | 6.01% | -0.23% |
| FCF Growth (5Y CAGR) ⓘ | -14.64% | 4.91% |
Quality (Business durability) | ||
| ROIC (Latest) ⓘ | 13.56% | 12.61% |
| ROIC (5Y Median) ⓘ | 15.28% | 10.72% |
| Net Debt / EBIT (Latest) ⓘ | 6.19 | 2.10 |
| Net Debt / EBIT (5Y Median) ⓘ | 5.69 | 2.32 |
| Operating Margin (Latest) ⓘ | 28.16% | 9.25% |
| Operating Margin (5Y Median) ⓘ | 30.04% | 9.64% |
| Debt to Equity (Latest) ⓘ | 2121.22% | 75.78% |
| Profit Margin (Latest) ⓘ | 8.43% | 5.33% |
| Free Cash Flow (Latest) ⓘ | $537.83M | |
Momentum (Price trend) | ||
| 3Y Return ⓘ | +41.33% | +14.53% |
| 12M Return (excl. last month) ⓘ | +8.20% | +3.08% |
| 6M Return ⓘ | -2.30% | +0.55% |
| Price vs. 200-Day MA ⓘ | -5.74% | -0.54% |
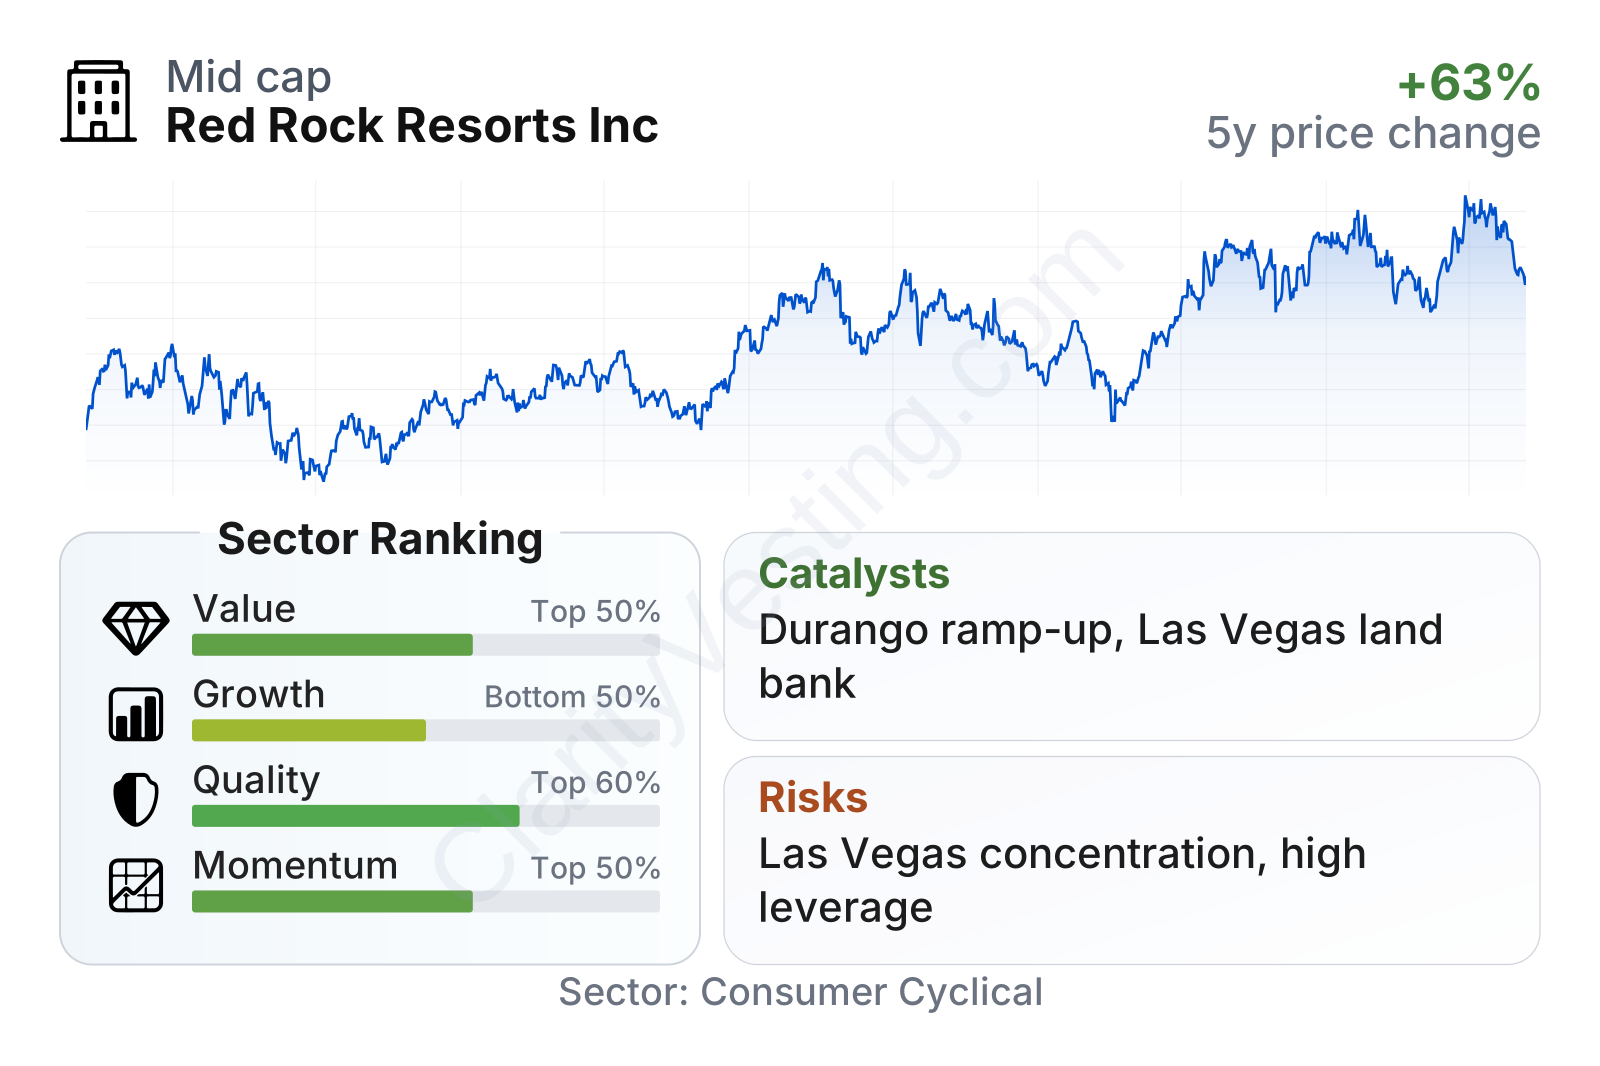
Red Rock Resorts is a mid-sized public company with a stock that has shown above-average volatility, reflected in a beta above 1.3. On valuation measures, it looks mixed: the earnings multiple is somewhat above the sector median, but cash-generation metrics are stronger than many peers, with free cash flow yield and EBIT relative to enterprise value coming in above sector norms. Quality metrics are also notable. Returns on invested capital are ahead of the industry median, and operating margins are much stronger than the typical company in the sector. The weak point is growth, which currently ranks in the lower half of the sector because recent revenue and earnings expansion have slowed compared with peers. Price momentum, however, has remained better than average over the medium term.
Growth
The broader sector can grow over time, but Red Rock Resorts is not simply a generic casino operator riding national gaming demand. Its real growth case is tied to the Las Vegas locals market. That market benefits from long-term population expansion, household formation, job creation, and new residential development across the Las Vegas Valley. A locals-oriented casino can benefit from repeat visits and customer loyalty in a way that is different from destination resorts that rely on convention traffic and vacation spending.
The company’s strategy is relatively easy to understand: expand where local demand is increasing, improve the value of existing properties, and use attractive land holdings to support future development. Red Rock Resorts has repeatedly emphasized its owned land bank in the Las Vegas area as a long-term advantage. That matters because suitable casino sites in growing neighborhoods are limited, zoning and entitlements can be hard to secure, and replacement costs for new integrated casino properties are high.
Near-term growth has been uneven. Revenue growth was strong during much of 2024 and parts of 2025, but the most recent year-over-year reading turned slightly negative, which helps explain why the company currently screens as below-average on growth versus the wider consumer cyclical sector. Even so, the longer-term record is better than the latest quarter suggests, with roughly 9% annualized revenue-per-share growth over five years. In other words, the company has grown over time, but not in a straight line.
Cash generation has recently improved materially. Free cash flow was negative in parts of 2023 and 2024, likely reflecting investment timing and capital spending, but it turned strongly positive again by 2026. That rebound is important for a capital-intensive business because free cash flow supports debt service, land development, and shareholder returns without depending entirely on outside financing.
One of the clearest catalysts is the long runway for development on owned sites in the Las Vegas region. Another is the Durango property, which has added a newer asset to the portfolio and gives the company a base for ramping customer volumes in a growing area. Continued maturation of newer properties, combined with additional future openings on existing land, could support growth without requiring the company to reinvent its model.
Recent corporate updates have also pointed to ongoing property optimization, disciplined capital allocation, and active management of the development pipeline. For a company in this niche, the biggest opportunities are usually not dramatic acquisitions but careful expansion in neighborhoods where demographics are moving in its favor.
Risks
This article is for informational purposes only and does not constitute financial advice. Some content is AI-generated. See Disclaimer


