Stock Analysis · Roku Inc (ROKU)
Overview
Roku is a digital TV platform company. It makes streaming devices, licenses its operating system to television manufacturers, runs an advertising and content distribution platform, and earns fees when viewers subscribe to services or rent content through Roku’s ecosystem. In simple terms, Roku wants to be the main software layer between viewers, advertisers, and streaming services.
The business is organized into two main segments, and the revenue mix is very uneven. Based on Roku’s recent annual reporting, the larger source is Platform revenue, while Devices revenue is much smaller.
- Platform revenue: about 85% to 86% of total revenue. This includes video advertising sold on Roku channels and apps, revenue-sharing from subscriptions and transactions billed through Roku, content distribution arrangements, search and home-screen promotions, and licensing tied to Roku TV activities.
- Devices revenue: about 14% to 15% of total revenue. This includes streaming players, audio products, smart home products, and related accessories sold to consumers and retailers.
This mix matters because Roku’s higher-value business is not the hardware itself. Devices help expand the installed base, but the long-term economics depend much more on monetizing viewing time, advertising demand, and the company’s role as a gatekeeper for streaming discovery.
One notable financial trend over the last several years is that revenue has kept rising while expense growth has become more controlled. Gross profit has expanded steadily, and after large operating losses in 2022 through 2024, Roku returned to positive operating income and net income in 2025. That suggests the company is moving from a scale-building phase toward a more disciplined monetization phase.
Key Figures
| Metric | Value | Sector ⓘ |
|---|---|---|
| Date | Sep 12, 2026 | |
| Context | ||
| Sector | Communication Services | |
| Industry | Entertainment | |
| Market Cap ⓘ | $22.87B | |
| Beta ⓘ | 2.05 | |
Value (Cheapness) | ||
| P/E Ratio ⓘ | 65.03 | 18.61 |
| FCF Yield ⓘ | 3.61% | 13.68% |
| EBIT / EV ⓘ | 1.87% | 4.54% |
| PEG ⓘ | 0.60 | |
Growth (Business expansion) | ||
| Revenue Growth ⓘ | 21.90% | 5.40% |
| RPS Growth (5Y CAGR) ⓘ | 12.62% | 4.62% |
| EPS Growth (5Y CAGR) ⓘ | N/A | -18.01% |
| Margin Growth (5Y Trend) ⓘ | N/A | 1.10% |
| FCF Growth (5Y CAGR) ⓘ | 26.30% | 5.88% |
Quality (Business durability) | ||
| ROIC (Latest) ⓘ | 13.25% | 8.38% |
| ROIC (5Y Median) ⓘ | -3.87% | 8.32% |
| Net Debt / EBIT (Latest) ⓘ | -3.92 | 1.99 |
| Net Debt / EBIT (5Y Median) ⓘ | N/A | 2.94 |
| Operating Margin (Latest) ⓘ | 7.48% | 14.89% |
| Operating Margin (5Y Median) ⓘ | -2.91% | 12.96% |
| Debt to Equity (Latest) ⓘ | 16.79% | 59.59% |
| Profit Margin (Latest) ⓘ | 6.82% | 8.77% |
| Free Cash Flow (Latest) ⓘ | $824.98M | |
Momentum (Price trend) | ||
| 3Y Return ⓘ | +90.57% | +46.64% |
| 12M Return (excl. last month) ⓘ | +80.02% | +2.16% |
| 6M Return ⓘ | +63.43% | +5.05% |
| Price vs. 200-Day MA ⓘ | +29.96% | +2.88% |
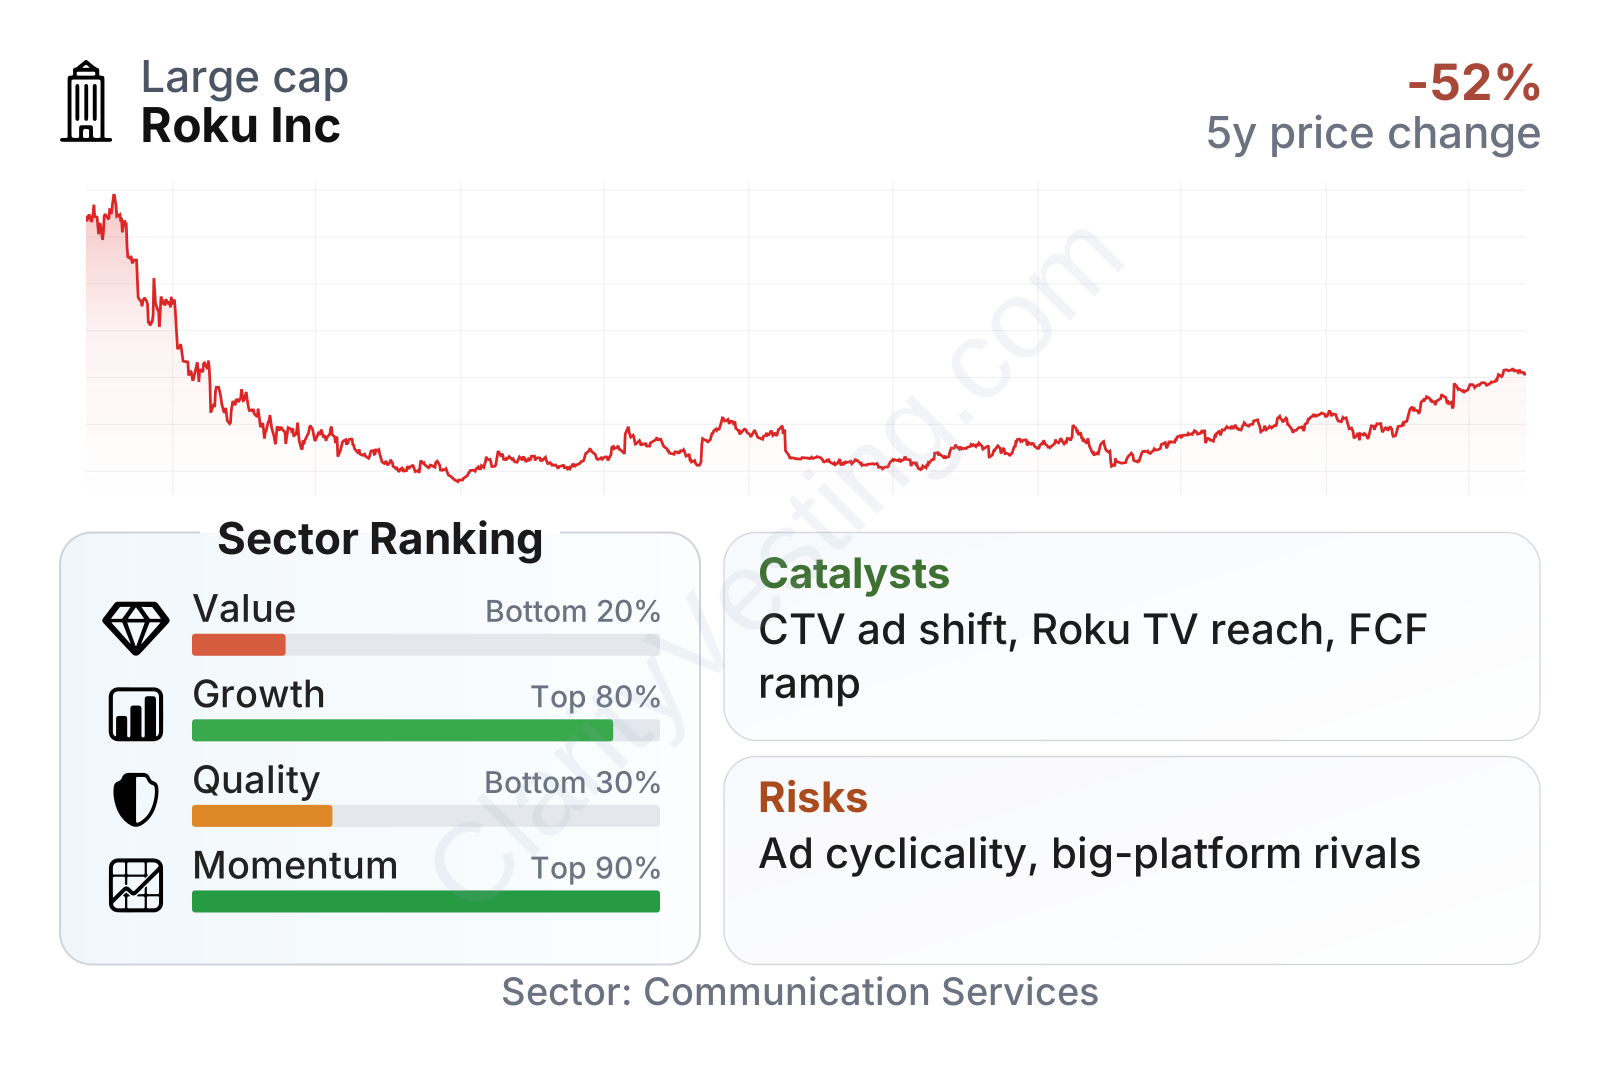
Roku is now a large-cap company, but it still trades with the volatility of a growth stock. Its beta is above 2, which means the share price has historically moved much more sharply than the broader market. The factor profile is also unusual: growth and market momentum rank near the top of the sector, while value and overall quality rank near the bottom. In practical terms, the market is rewarding Roku for accelerating expansion and improving cash generation, but it is still discounting the business for thin margins and a history of losses. Balance-sheet strength stands out positively, with low leverage and net cash rather than heavy debt dependence.
Growth
Roku operates in a sector with durable long-term tailwinds. Traditional linear television continues to lose attention to streaming, and advertising budgets are gradually following audience time toward connected TV. That broader shift gives Roku a favorable backdrop because its platform sits at the point where viewers choose apps, where advertisers want access to TV audiences, and where content companies compete for visibility.
Its strategy is logical for future growth. Roku keeps widening household reach through streaming players and Roku TV licensing, then tries to increase revenue per user through advertising, subscription distribution, home-screen placements, and Roku-branded content experiences. This model can scale well because once an account base is built, each extra dollar of platform monetization tends to be more attractive than hardware revenue.
The recent growth trend looks strong relative to the sector. After a major slowdown in 2022 and early 2023, year-over-year revenue growth re-accelerated and has recently stayed around the low-20% range, well above the sector median. That points to better ad demand, stronger monetization, or both. Over a five-year period, revenue per share growth has also been materially ahead of the industry midpoint, which supports the idea that Roku is still gaining economic scale rather than just treading water.
Cash generation has improved meaningfully. Free cash flow moved from negative territory in 2023 to clearly positive levels afterward, and the trailing trend has crossed above $1 billion. That is an important shift because it suggests Roku’s operating model is no longer relying on the same degree of cash burn to support expansion. For a platform business, stronger free cash flow can create more flexibility for product development, content initiatives, and selective partnerships.
Recent company announcements also support the growth case. Roku has continued expanding ad tools, commerce features, and smart TV distribution, while using its home screen and operating system position to deepen engagement. The company’s push into more shoppable advertising formats and better advertiser measurement could become a significant opportunity if connected TV budgets keep moving away from traditional TV.
Risks
This article is for informational purposes only and does not constitute financial advice. Some content is AI-generated. See Disclaimer


