Stock Analysis · Reynolds Consumer Products Inc (REYN)
Overview
Reynolds Consumer Products Inc. is a household products company focused on everyday disposable and food storage items used in kitchens, homes, and waste management. Its best-known brands include Reynolds Wrap aluminum foil, Hefty trash bags, Hefty tableware, and a range of cooking, storage, and disposal products sold mainly through large retailers, grocery chains, club stores, and e-commerce channels in the United States and selected international markets.
The business is built around products that are inexpensive for consumers, frequently repurchased, and tied to routine household use rather than major discretionary spending. That makes Reynolds more of a steady consumer staples-like operator in practice, even though it is commonly grouped within consumer-related manufacturing categories.
Based on the company’s segment reporting, revenue is mainly generated from four operating areas.
- Reynolds Cooking & Baking: about 32% of revenue. This includes aluminum foil, parchment paper, disposable bakeware, slow cooker liners, and related kitchen prep products.
- Hefty Waste & Storage: about 28% of revenue. This segment includes trash bags, food storage bags, and related household storage products.
- Hefty Tableware: about 22% of revenue. This covers disposable plates, bowls, cups, cutlery, and party-oriented tableware.
- Presto Products: about 18% of revenue. This unit sells private-label and store-brand food storage bags, trash bags, and specialty products, along with some products for retail and institutional customers.
Those percentages are approximate and can shift modestly by year, but they show an important point: Reynolds is not dependent on a single product line, although foil and waste bags remain especially important anchors of the portfolio.
The broader financial picture shows a company with revenue that has stayed close to the same range in recent years, while profitability has moved around more noticeably as material costs and pricing changed. Gross profit and operating income improved strongly from 2022 to 2024, then softened in 2025, which highlights how much earnings depend on input costs, product mix, and promotional intensity rather than on fast unit growth alone.
Key Figures
| Metric | Value | Sector ⓘ |
|---|---|---|
| Date | Sep 12, 2026 | |
| Context | ||
| Sector | Consumer Cyclical | |
| Industry | Packaging & Containers | |
| Market Cap ⓘ | $4.58B | |
| Beta ⓘ | 0.53 | |
Value (Cheapness) | ||
| P/E Ratio ⓘ | 13.34 | 17.10 |
| FCF Yield ⓘ | 6.98% | 8.53% |
| EBIT / EV ⓘ | 8.03% | 6.46% |
| PEG ⓘ | N/A | |
Growth (Business expansion) | ||
| Revenue Growth ⓘ | 0.60% | 5.75% |
| RPS Growth (5Y CAGR) ⓘ | 1.07% | 9.14% |
| EPS Growth (5Y CAGR) ⓘ | -16.04% | -18.21% |
| Margin Growth (5Y Trend) ⓘ | -0.46% | -0.23% |
| FCF Growth (5Y CAGR) ⓘ | 16.94% | 4.91% |
Quality (Business durability) | ||
| ROIC (Latest) ⓘ | 9.92% | 12.61% |
| ROIC (5Y Median) ⓘ | 9.58% | 10.72% |
| Net Debt / EBIT (Latest) ⓘ | 3.22 | 2.10 |
| Net Debt / EBIT (5Y Median) ⓘ | 3.50 | 2.32 |
| Operating Margin (Latest) ⓘ | 13.00% | 9.25% |
| Operating Margin (5Y Median) ⓘ | 13.33% | 9.64% |
| Debt to Equity (Latest) ⓘ | 71.34% | 75.78% |
| Profit Margin (Latest) ⓘ | 9.09% | 5.33% |
| Free Cash Flow (Latest) ⓘ | $320.00M | |
Momentum (Price trend) | ||
| 3Y Return ⓘ | -5.48% | +14.53% |
| 12M Return (excl. last month) ⓘ | +20.42% | +3.08% |
| 6M Return ⓘ | +3.35% | +0.55% |
| Price vs. 200-Day MA ⓘ | -5.67% | -0.54% |
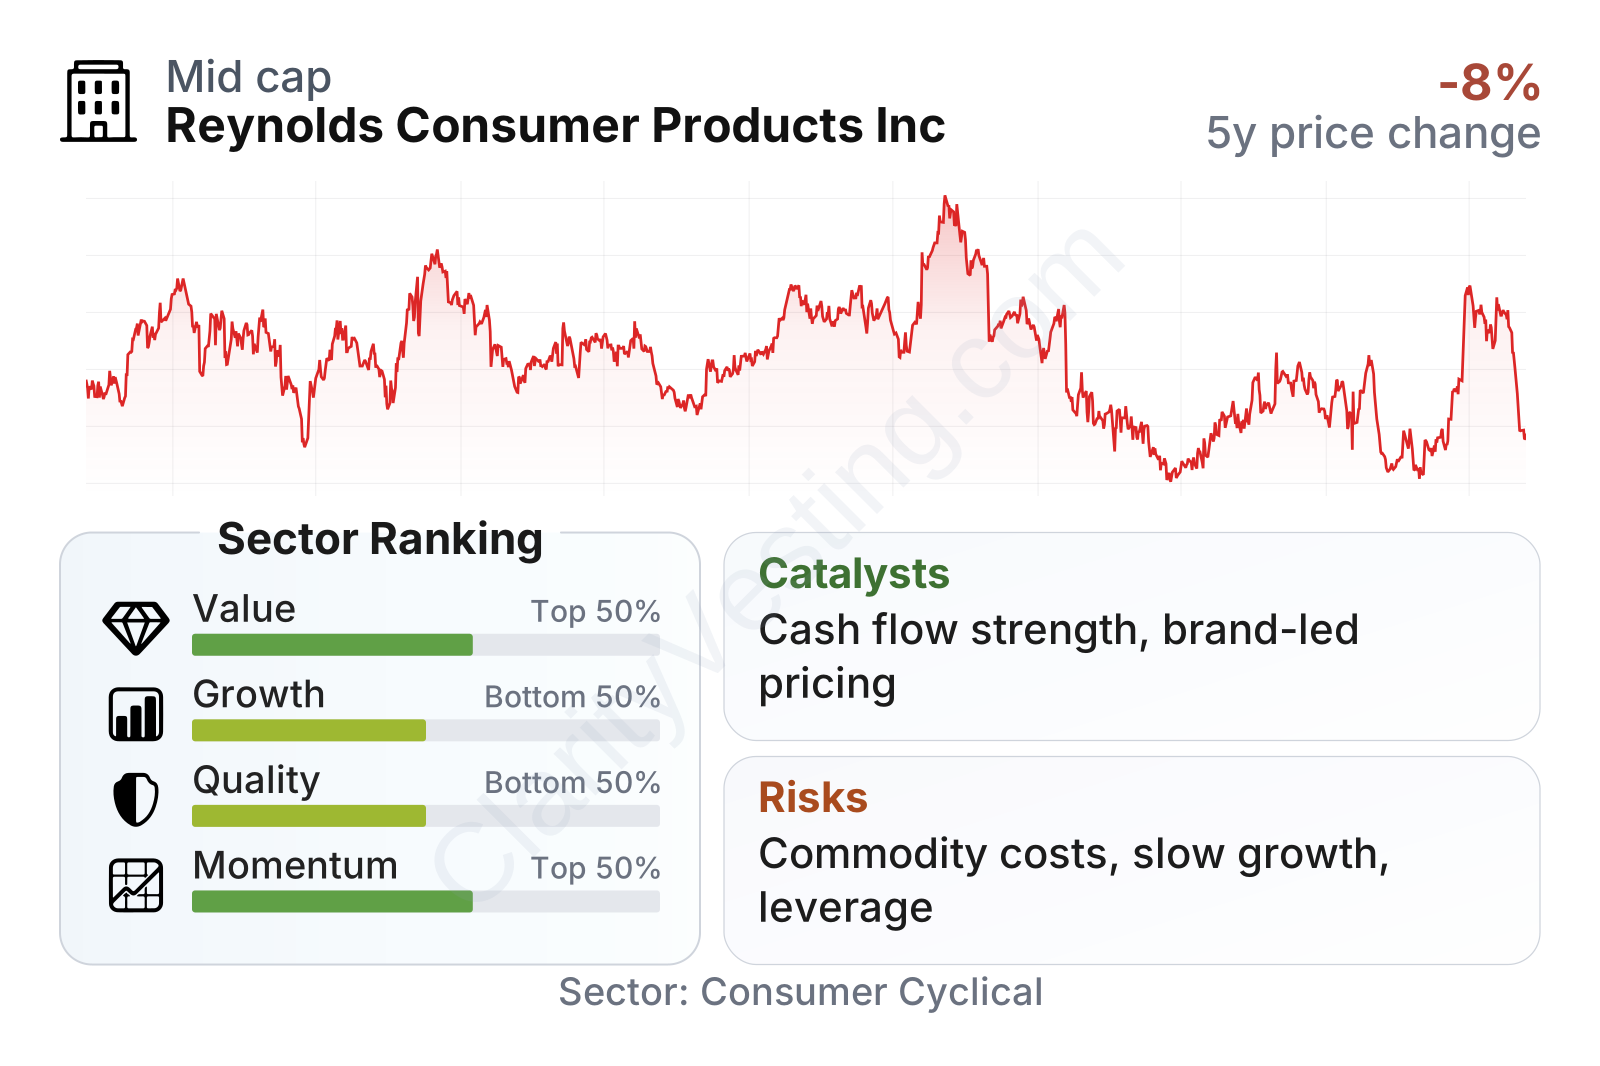
Reynolds is a mid-sized consumer products company with relatively low share-price volatility, as reflected by a beta well below 1. In the latest factor snapshot, value looks somewhat better than growth and quality: the earnings multiple sits below the sector median, but revenue expansion has been slow and debt remains heavier than many peers when measured against operating profit. Profitability, however, is a brighter spot, with operating and net margins above sector medians. Momentum has recently improved, suggesting the market has responded favorably over the last year even though the longer multi-year stock performance has been modest.
Growth
Reynolds operates in a mature category rather than a high-growth industry. Household foil, trash bags, food storage bags, and disposable tableware are essential-use products with stable long-term demand, but they usually do not deliver rapid volume growth. That means the company’s expansion path depends more on pricing, product innovation, premium offerings, retailer penetration, private-label contracts, manufacturing efficiency, and selective category share gains than on a fast-growing end market.
That does not make the business unattractive for long-term analysis; it simply changes what growth means. For Reynolds, a sensible growth strategy is one that protects shelf space, keeps brands relevant, improves margins, and converts earnings into cash. This appears broadly consistent with how the company has been operating.
Revenue growth has been uneven. After strong gains in 2021 and 2022, growth slowed materially, turned negative through much of 2023 and part of 2024, and then returned to low positive territory with one stronger quarter in early 2026. In other words, Reynolds has recently shown stabilization more than acceleration. That matters because the market is likely to view the company as a steady cash generator first and a growth company second.
One encouraging point is cash generation.
Free cash flow improved sharply from earlier levels and has remained solid even after coming down from a peak period. Over the last five years, free cash flow has grown much faster than revenue, which suggests management has been able to defend earnings quality and working capital efficiency despite a low-growth top line. For a mature household products company, that is a meaningful positive sign.
Strategically, Reynolds has a few realistic growth levers. It can continue pushing innovation in cooking and storage, where convenience and sustainability-related features can support pricing. It can also benefit from retailer demand for dependable supply partners in both branded and private-label products. In addition, categories tied to food-at-home habits remain resilient, which supports repeat purchases across foil, bags, and food storage.
Recent company updates have also emphasized productivity, cost discipline, and targeted brand investment. For Reynolds, these are important because a modest revenue increase combined with controlled costs can still produce worthwhile earnings improvement. The main catalyst is therefore not a dramatic market expansion, but a combination of pricing discipline, category stability, and improved cash conversion.
Risks
This article is for informational purposes only and does not constitute financial advice. Some content is AI-generated. See Disclaimer


