Stock Analysis · Royal Caribbean Cruises Ltd (RCL)
Overview
Royal Caribbean Cruises Ltd is one of the largest cruise companies in the world. It operates vacation travel businesses built around ocean cruises and also manages related experiences such as private destinations, onboard services, and land-based packages tied to cruises. The group runs several brands, with Royal Caribbean International as the largest, alongside Celebrity Cruises and Silversea, which target different customer segments from mainstream family cruising to premium and luxury travel.
The business makes most of its money from selling passenger tickets, but onboard spending is also an important contributor. Based on the company’s recent annual reporting structure, revenue can be understood in two main buckets:
- Passenger ticket revenue: about 72% to 76% of total revenue. This includes the cruise fare itself and transportation-related components sold as part of the trip.
- Onboard and other revenue: about 24% to 28% of total revenue. This includes beverage packages, casino activity, specialty dining, Wi-Fi, spa services, shore excursions, retail purchases, and certain air or land packages.
Brand mix is also important. Royal Caribbean International is the core engine of the group, while Celebrity and Silversea broaden pricing power and customer reach. That brand spread helps the company serve multiple income levels and trip styles without depending on a single cruise format.
The business has moved far beyond its pandemic recovery phase. Over the last several years, revenue has climbed sharply while interest expense has come down from earlier elevated levels, helping net income expand much faster than sales. That improvement matters because cruises are a high fixed-cost business: once ships are filled at strong prices, profitability can rise quickly.
Key Figures
| Metric | Value | Sector ⓘ |
|---|---|---|
| Date | Sep 12, 2026 | |
| Context | ||
| Sector | Consumer Cyclical | |
| Industry | Travel Services | |
| Market Cap ⓘ | $69.57B | |
| Beta ⓘ | 1.75 | |
Value (Cheapness) | ||
| P/E Ratio ⓘ | 16.07 | 17.10 |
| FCF Yield ⓘ | -0.60% | 8.53% |
| EBIT / EV ⓘ | 5.99% | 6.46% |
| PEG ⓘ | 1.05 | |
Growth (Business expansion) | ||
| Revenue Growth ⓘ | 6.50% | 5.75% |
| RPS Growth (5Y CAGR) ⓘ | 81.28% | 9.14% |
| EPS Growth (5Y CAGR) ⓘ | N/A | -18.21% |
| Margin Growth (5Y Trend) ⓘ | 288.54% | -0.23% |
| FCF Growth (5Y CAGR) ⓘ | N/A | 4.91% |
Quality (Business durability) | ||
| ROIC (Latest) ⓘ | 16.02% | 12.61% |
| ROIC (5Y Median) ⓘ | 11.81% | 10.72% |
| Net Debt / EBIT (Latest) ⓘ | 4.11 | 2.10 |
| Net Debt / EBIT (5Y Median) ⓘ | 4.55 | 2.32 |
| Operating Margin (Latest) ⓘ | 29.48% | 9.25% |
| Operating Margin (5Y Median) ⓘ | 22.35% | 9.64% |
| Debt to Equity (Latest) ⓘ | 229.76% | 75.78% |
| Profit Margin (Latest) ⓘ | 23.54% | 5.33% |
| Free Cash Flow (Latest) ⓘ | -$416.00M | |
Momentum (Price trend) | ||
| 3Y Return ⓘ | +170.20% | +14.53% |
| 12M Return (excl. last month) ⓘ | +0.06% | +3.08% |
| 6M Return ⓘ | -1.88% | +0.55% |
| Price vs. 200-Day MA ⓘ | -9.15% | -0.54% |
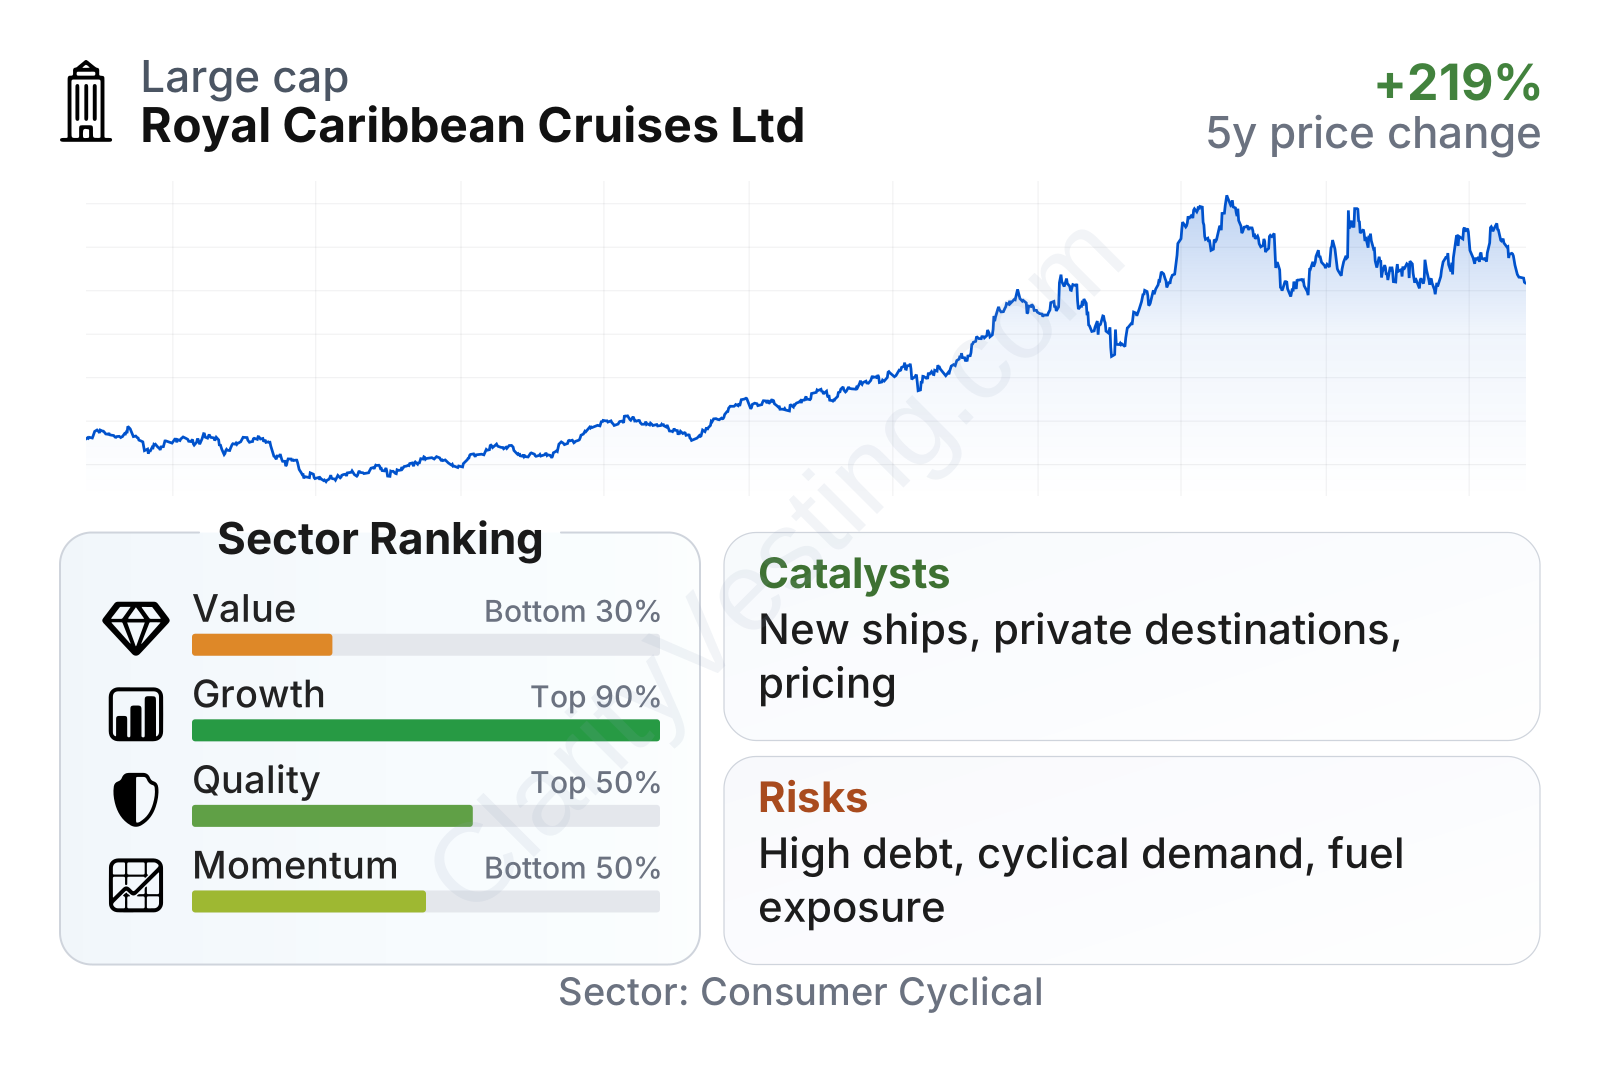
Royal Caribbean is now a very large travel company with above-average share price volatility, reflected in a beta well above 1. The overall profile is mixed but understandable: growth ranks near the top of the sector, quality is solid to good, momentum is still positive over longer periods, while value looks less attractive because the market already recognizes much of the recovery and earnings strength. Profitability metrics stand out, but leverage remains notably higher than most peers.
Growth
The cruise industry is part of the broader leisure travel market, which remains supported by long-term demand for experiences rather than goods. Cruises still account for a relatively small share of the global vacation market, which leaves room for further penetration if operators continue to attract first-time guests and upsell repeat travelers. Demographic tailwinds also help: retirees are an important customer base, but cruise companies are increasingly targeting families, younger adults, and premium travelers.
Royal Caribbean’s strategy for future growth is coherent. It is adding capacity through new ships, pushing higher-yield premium offerings, and expanding its destination ecosystem with private and exclusive experiences that keep more customer spending inside the company’s network. This matters because the company is not relying only on passenger volume. A meaningful part of recent progress has come from stronger pricing and higher onboard spending per guest.
Revenue growth has normalized from the extreme rebound phase, but it is still running ahead of the sector median. That is a healthier pattern than purely explosive post-crisis growth because it suggests the company is now expanding from an already much larger base. Over a five-year view, revenue per share growth has been exceptional, showing how sharply the business has rebuilt its earning power.
Cash generation has also improved materially since the reopening period, even if it can fluctuate because cruise operators spend heavily on ships, maintenance, and timing-related working capital. The broader trend has been favorable: the company moved from deeply negative cash generation during the disruption period to strong positive levels later on. That supports debt reduction, fleet investment, and more flexibility in the business model.
Another important catalyst is product innovation. Royal Caribbean has been introducing larger, more feature-rich ships designed to drive both occupancy and onboard spending. The company has also highlighted strong booked positions and continued demand for new ships and private destinations in its investor materials and earnings communications. For a cruise operator, those are high-impact drivers because they influence ticket pricing, guest spending, and brand visibility at the same time.
Recent company updates have also pointed to continued expansion of destination offerings, including beach club and private destination development. These projects can strengthen pricing power because they make the vacation package more distinctive and harder to compare directly with a standard hotel stay or a competing cruise itinerary.
Risks
This article is for informational purposes only and does not constitute financial advice. Some content is AI-generated. See Disclaimer


