Stock Analysis · Pursuit Attractions and Hospitality Inc (PRSU)
Overview
Pursuit Attractions and Hospitality Inc is a travel and hospitality company focused on destination-based experiences. Its assets are concentrated in well-known scenic tourism markets, especially the Canadian Rockies, Alaska, Iceland, and parts of the continental United States. Rather than operating as a broad online travel platform, the company owns and runs physical tourism businesses: sightseeing attractions, lodging, food and beverage venues, and transportation services tied to leisure destinations.
The business model is built around capturing spending across an entire trip. A guest might stay in one of the company’s hotels or lodges, take a branded attraction, use a transportation service, and spend on dining or retail on site. That creates a more integrated revenue base than a single-product tourism operator and helps the company benefit from rising visitor volumes and higher guest spending.
Based on company disclosures, revenue mainly comes from three operating streams, with exact proportions shifting by season and by year:
- Attractions and sightseeing experiences: approximately 35% to 45% of revenue. This includes branded destination attractions such as gondolas, cruises, skywalk-style experiences, and other ticketed tourism activities.
- Hospitality and lodging: approximately 30% to 40% of revenue. This includes hotels, lodges, and related guest accommodations in high-traffic leisure markets.
- Food, beverage, retail, and transportation: approximately 20% to 30% of revenue. This includes restaurants, cafes, gift shops, and transportation services connected to attractions and overnight stays.
The company is still relatively small in stock market size compared with major global travel groups, but its niche is more specialized: high-demand outdoor destinations with limited supply and strong pricing potential during peak tourism periods.
Over the last several years, the business mix has also improved operationally. Revenue recovered from the post-pandemic period, operating income moved from losses to profits and then became more volatile again, while net income has been affected by some non-operating and one-time items. The broad takeaway is that the underlying business has been rebuilding, but reported earnings have not always moved in a straight line.
The long-term picture shows a business that moved from deep losses in 2021 to much healthier gross profit and operating performance by 2023 and 2025. One unusual year appears to have been heavily influenced by accounting or one-time items, so operating trends are more informative than net income alone.
Key Figures
| Metric | Value | Sector ⓘ |
|---|---|---|
| Date | Sep 12, 2026 | |
| Context | ||
| Sector | Consumer Cyclical | |
| Industry | Travel Services | |
| Market Cap ⓘ | $1.33B | |
| Beta ⓘ | 1.38 | |
Value (Cheapness) | ||
| P/E Ratio ⓘ | 32.37 | 17.10 |
| FCF Yield ⓘ | -0.41% | 8.53% |
| EBIT / EV ⓘ | 5.13% | 6.46% |
| PEG ⓘ | 1.73 | |
Growth (Business expansion) | ||
| Revenue Growth ⓘ | 14.30% | 5.75% |
| RPS Growth (5Y CAGR) ⓘ | -10.52% | 9.14% |
| EPS Growth (5Y CAGR) ⓘ | N/A | -18.21% |
| Margin Growth (5Y Trend) ⓘ | 27.27% | -0.23% |
| FCF Growth (5Y CAGR) ⓘ | -70.25% | 4.91% |
Quality (Business durability) | ||
| ROIC (Latest) ⓘ | N/A | 12.61% |
| ROIC (5Y Median) ⓘ | N/A | 10.72% |
| Net Debt / EBIT (Latest) ⓘ | 2.68 | 2.10 |
| Net Debt / EBIT (5Y Median) ⓘ | 13.92 | 2.32 |
| Operating Margin (Latest) ⓘ | 16.17% | 9.25% |
| Operating Margin (5Y Median) ⓘ | 1.53% | 9.64% |
| Debt to Equity (Latest) ⓘ | 45.37% | 75.78% |
| Profit Margin (Latest) ⓘ | 7.95% | 5.33% |
| Free Cash Flow (Latest) ⓘ | -$5.44M | |
Momentum (Price trend) | ||
| 3Y Return ⓘ | +77.58% | +14.53% |
| 12M Return (excl. last month) ⓘ | +34.16% | +3.08% |
| 6M Return ⓘ | +32.25% | +0.55% |
| Price vs. 200-Day MA ⓘ | +15.83% | -0.54% |
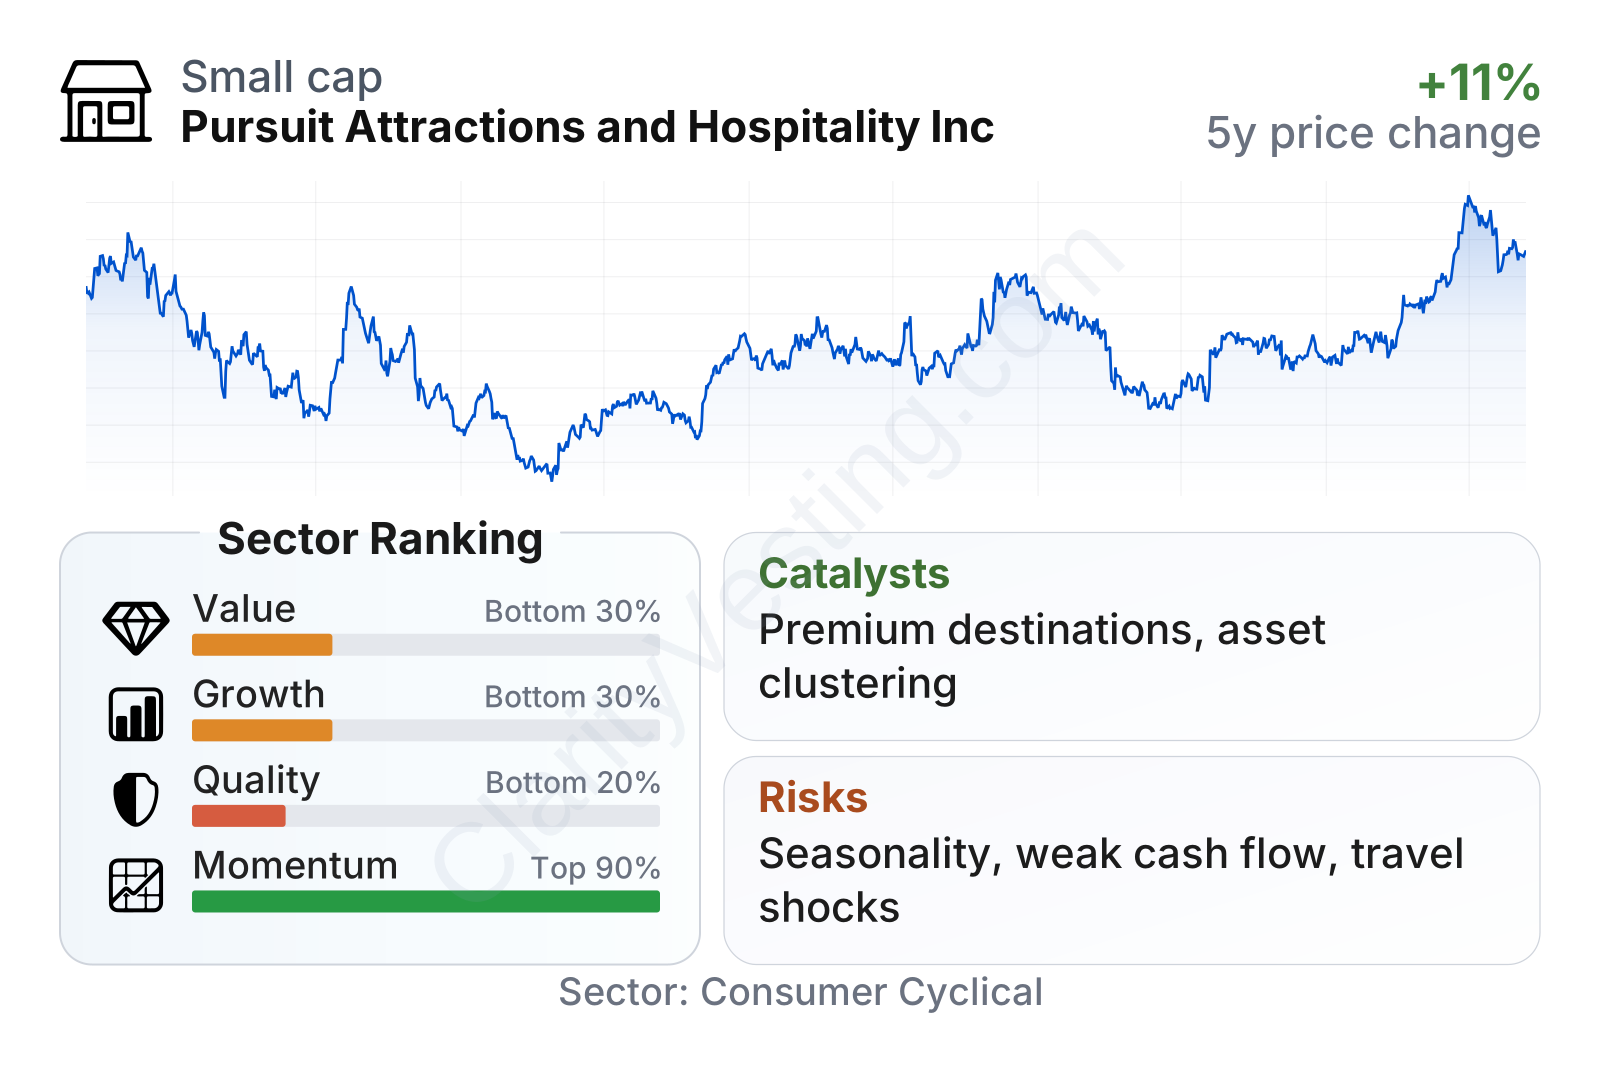
The company shows a mixed profile. Share-price momentum has been much stronger than most of the consumer cyclical sector, reflecting market enthusiasm around the recovery and growth outlook. Profitability is better than sector medians on operating margin and net margin, but overall quality and value rankings remain weaker because leverage is still meaningful relative to earnings and free cash flow is currently negative. Growth also looks uneven: recent year-over-year revenue growth is ahead of the sector, yet longer-term cash flow and per-share growth have been inconsistent.
Pursuit’s market value places it in the smaller public-company range, which can create more upside from successful expansion but also more sensitivity to tourism cycles, weather, and project execution. Its beta above 1 also suggests the stock tends to move more than the broad market.
Growth
The company operates in a favorable long-term niche. Experiential travel, outdoor tourism, and destination-based spending have generally held up well as consumers increasingly prioritize memorable trips over purely discretionary goods. Scenic attractions with natural barriers to entry can be especially attractive because demand can grow without requiring a national chain footprint.
Pursuit’s strategy also makes sense for future growth. Management has been building clusters of assets in the same destination markets, which can increase cross-selling and improve marketing efficiency. In practical terms, that means one guest can generate several revenue streams during the same trip. This cluster approach may also strengthen pricing power because travelers often prefer convenience and packaged experiences in remote or premium destinations.
Revenue growth has been volatile, which is normal for a company exposed to seasonality, reopening effects, acquisitions, and destination-specific disruptions. Even so, the latest year-over-year growth rate sits above the sector median, suggesting the business is still expanding faster than many travel-related peers at this point in the cycle.
The main weakness in the growth profile is cash conversion. Free cash flow has remained negative recently after briefly turning positive, which points to continued investment needs, seasonal working-capital swings, or expansion spending. For a destination operator, that is not automatically a red flag, but it does mean growth is not yet translating consistently into surplus cash.
A meaningful catalyst is the company’s exposure to premium tourism destinations where supply is structurally limited. In those markets, incremental demand can lift occupancy, ticket volumes, and pricing at the same time. Another catalyst is continued international tourism normalization, especially in iconic nature-based markets that attract high-spending travelers. If management continues to add or upgrade attractions, rooms, and bundled guest offerings in the same regions, the company could deepen its share of visitor spending without needing to enter many new geographies.
Recent company communications and filings have also emphasized development and enhancement projects across key destinations, which supports the idea that growth is expected to come from both new capacity and better monetization of existing assets rather than simple cost cutting.
Risks
This article is for informational purposes only and does not constitute financial advice. Some content is AI-generated. See Disclaimer


