Stock Analysis · United Parks & Resorts Inc (PRKS)
Overview
United Parks & Resorts Inc. operates regional theme parks, water parks, marine-life parks, and resort-style entertainment destinations in the United States. The company is best known for the SeaWorld, Busch Gardens, Aquatica, Discovery Cove, Sesame Place, Water Country USA, and Adventure Island brands. Its business is built around attracting guests to destination parks, encouraging higher in-park spending, and using seasonal events, animal experiences, rides, food, lodging partnerships, and pass programs to increase repeat visits.
Revenue is generated mostly from guests visiting the parks and spending money once they are inside. Based on recent annual reporting, the mix is approximately:
- Admissions: about 58% — single-day tickets, annual passes, membership products, and other entry-related purchases.
- In-park spending: about 37% — food and beverage, merchandise, games, animal interactions, photo products, and other guest extras.
- Other revenue: about 5% — sponsorships, licensing, and additional partnership-related income.
The company’s parks are physical assets with high fixed costs, which means attendance and per-capita guest spending matter a great deal. When parks are busy, profitability can scale well. When attendance softens, margins can come under pressure quickly. Over the last several years, the business has shown that it can still produce solid operating income and cash flow even while revenue growth has been uneven.
The financial flow also shows a useful pattern: revenue stayed fairly stable from 2022 through 2024 at roughly $1.7 billion, while operating income remained strong. A weaker 2025 revenue figure appears alongside a sharp jump in cost of revenue, which stands out as a key area to monitor because it helps explain the pressure on earnings despite the business still remaining profitable.
Key Figures
| Metric | Value | Sector ⓘ |
|---|---|---|
| Date | Sep 12, 2026 | |
| Context | ||
| Sector | Consumer Cyclical | |
| Industry | Leisure | |
| Market Cap ⓘ | $1.65B | |
| Beta ⓘ | 1.14 | |
Value (Cheapness) | ||
| P/E Ratio ⓘ | 15.08 | 17.10 |
| FCF Yield ⓘ | 16.03% | 8.53% |
| EBIT / EV ⓘ | 7.61% | 6.46% |
| PEG ⓘ | N/A | |
Growth (Business expansion) | ||
| Revenue Growth ⓘ | -1.40% | 5.75% |
| RPS Growth (5Y CAGR) ⓘ | 12.47% | 9.14% |
| EPS Growth (5Y CAGR) ⓘ | -36.21% | -18.21% |
| Margin Growth (5Y Trend) ⓘ | -3.11% | -0.23% |
| FCF Growth (5Y CAGR) ⓘ | -8.43% | 4.91% |
Quality (Business durability) | ||
| ROIC (Latest) ⓘ | 13.34% | 12.61% |
| ROIC (5Y Median) ⓘ | 19.56% | 10.72% |
| Net Debt / EBIT (Latest) ⓘ | 7.64 | 2.10 |
| Net Debt / EBIT (5Y Median) ⓘ | 4.81 | 2.32 |
| Operating Margin (Latest) ⓘ | 18.96% | 9.25% |
| Operating Margin (5Y Median) ⓘ | 26.62% | 9.64% |
| Debt to Equity (Latest) ⓘ | -390.04% | 75.78% |
| Profit Margin (Latest) ⓘ | 8.11% | 5.33% |
| Free Cash Flow (Latest) ⓘ | $265.29M | |
Momentum (Price trend) | ||
| 3Y Return ⓘ | -23.67% | +14.53% |
| 12M Return (excl. last month) ⓘ | -11.90% | +3.08% |
| 6M Return ⓘ | +17.51% | +0.55% |
| Price vs. 200-Day MA ⓘ | -5.52% | -0.54% |
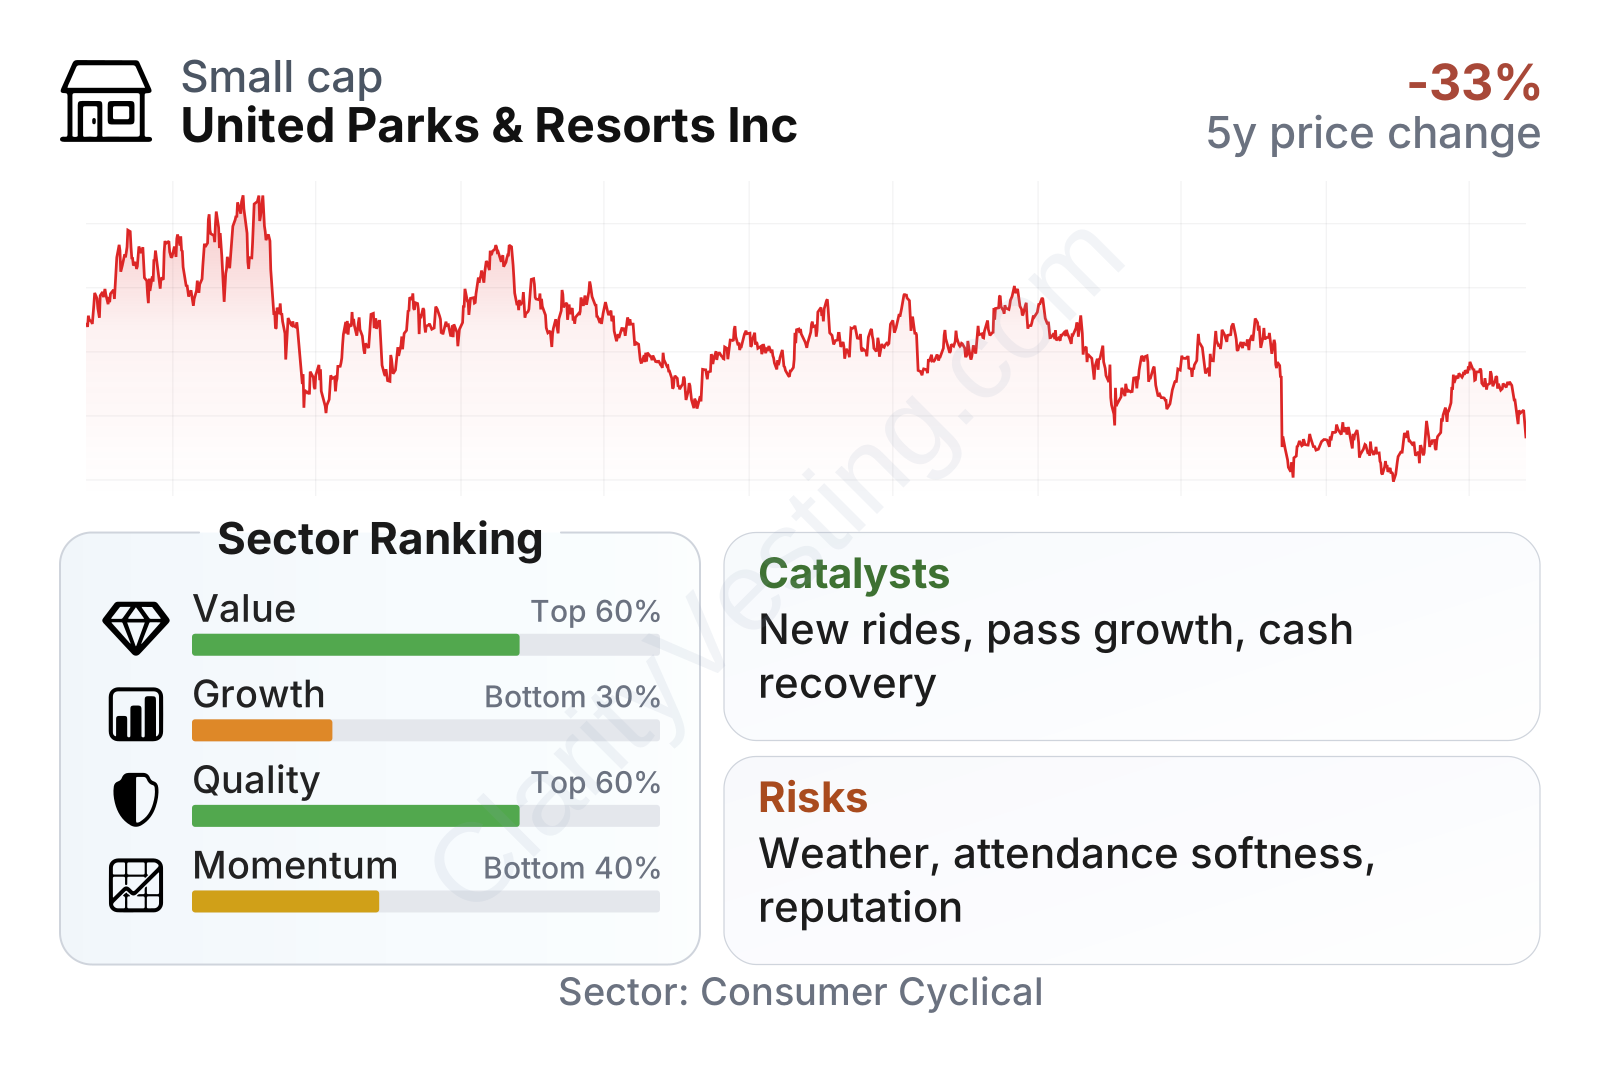
United Parks & Resorts is a mid-sized leisure company with a stock that has been volatile rather than steadily trending upward. The recent metrics paint a mixed picture. On valuation, the company sits around the middle of its sector on earnings, while cash generation looks stronger than many peers, with free cash flow yield above the sector median. On quality, the business still stands out: operating margins and returns on invested capital remain better than many companies in consumer discretionary activities. The weaker part is growth. Revenue has recently been slightly negative year over year, free cash flow growth over five years has been negative, and earnings growth has been under pressure. In short, the business currently looks more like a cash-generating operator than a clear growth leader.
Growth
The broader sector has favorable long-term traits. Consumers continue to spend on experiences, family entertainment, short-getaway travel, and event-driven leisure. Regional parks can benefit from this because they are usually more affordable and easier to access than large destination resorts. That creates a durable niche for companies that can keep attractions fresh and raise guest spending without damaging attendance.
United Parks & Resorts’ strategy is centered on adding rides, seasonal festivals, themed events, upgraded food offerings, VIP experiences, and pricing tools that encourage repeat visits and higher spending per guest. The company has also been working to rebalance its image away from being seen only as a marine park operator and more as a broader theme park platform. That strategic direction makes sense because it expands the addressable audience and reduces dependence on any single brand perception.
The near-term challenge is that growth has not been consistent. After the strong rebound years following the pandemic period, year-over-year revenue growth turned modestly negative and has stayed soft more recently. That suggests the company is now in a harder phase where attendance growth is more difficult and pricing alone is not enough to create sustained top-line momentum.
Cash generation gives a more encouraging signal than revenue alone. Free cash flow improved from the lows reached after 2022 and has recovered into the high hundreds of millions range on a trailing basis. For a park operator, this matters because cash funds new attractions, debt reduction, and operational upgrades. If management can stabilize attendance while preserving guest spending, free cash flow could remain a meaningful support for the business even without rapid revenue expansion.
A notable catalyst is the company’s continued capital investment in new rides and park additions across its brands. In this industry, major attraction launches can lift visitation, increase season pass interest, and support better pricing. The company has also emphasized operational initiatives and guest-experience improvements, which can help margins if demand remains healthy. Recent corporate communication has continued to highlight event programming, rides, and attendance-driving investments as central levers for future performance.
Risks
This article is for informational purposes only and does not constitute financial advice. Some content is AI-generated. See Disclaimer


