Stock Analysis · ePlus inc (PLUS)
Overview
ePlus inc is an information technology solutions provider that helps businesses and public-sector customers buy, design, finance, and manage complex IT systems. In simple terms, the company sits between major technology manufacturers and end customers, combining product resale with consulting and managed services. Its work typically includes cloud infrastructure, cybersecurity, networking, data center modernization, collaboration tools, and lifecycle support.
The business is organized around two main revenue engines. Based on recent annual reporting, the mix is heavily weighted toward product sales, while services carry a smaller share of revenue but are strategically important because they can deepen customer relationships and often provide steadier profitability.
- Product revenue: about 85% to 90% of total revenue. This includes hardware, software, subscriptions, and third-party technology solutions resold to customers. Large vendor relationships such as Cisco, Microsoft, Dell, HPE, and others are central to this segment.
- Service revenue: about 10% to 15% of total revenue. This includes consulting, professional services, managed services, support, installation, configuration, and recurring service contracts tied to customer IT environments.
- Financing income: small within total revenue, but still relevant to the business model. ePlus also offers financing and leasing solutions that can help customers spread the cost of technology purchases over time.
What stands out is that ePlus is not a pure software company despite being placed in a software-related market category by many databases. It is closer to a value-added reseller and IT solutions integrator, with earnings influenced by enterprise technology spending cycles, vendor relationships, and execution in higher-margin services.
The profit flow has improved again in the latest fiscal year, with revenue, gross profit, operating income, and net income all moving higher after a softer period in fiscal 2025. The latest picture also shows no meaningful interest expense, which fits with the company’s very light debt load.
Key Figures
| Metric | Value | Sector ⓘ |
|---|---|---|
| Date | Sep 12, 2026 | |
| Context | ||
| Sector | Technology | |
| Industry | Software - Application | |
| Market Cap ⓘ | $2.40B | |
| Beta ⓘ | 0.97 | |
Value (Cheapness) | ||
| P/E Ratio ⓘ | 18.86 | 29.51 |
| FCF Yield ⓘ | 2.28% | 4.25% |
| EBIT / EV ⓘ | 8.79% | 2.85% |
| PEG ⓘ | 1.03 | |
Growth (Business expansion) | ||
| Revenue Growth ⓘ | 1.00% | 15.40% |
| RPS Growth (5Y CAGR) ⓘ | 8.12% | 8.56% |
| EPS Growth (5Y CAGR) ⓘ | -36.29% | -11.88% |
| Margin Growth (5Y Trend) ⓘ | -1.02% | 0.46% |
| FCF Growth (5Y CAGR) ⓘ | N/A | 9.80% |
Quality (Business durability) | ||
| ROIC (Latest) ⓘ | 10.42% | 9.44% |
| ROIC (5Y Median) ⓘ | 11.49% | 8.30% |
| Net Debt / EBIT (Latest) ⓘ | -2.60 | 0.54 |
| Net Debt / EBIT (5Y Median) ⓘ | -0.70 | 0.44 |
| Operating Margin (Latest) ⓘ | 7.02% | 9.58% |
| Operating Margin (5Y Median) ⓘ | 7.19% | 8.25% |
| Debt to Equity (Latest) ⓘ | 1.52% | 33.33% |
| Profit Margin (Latest) ⓘ | 4.91% | 7.14% |
| Free Cash Flow (Latest) ⓘ | $54.77M | |
Momentum (Price trend) | ||
| 3Y Return ⓘ | +45.79% | +45.48% |
| 12M Return (excl. last month) ⓘ | +24.63% | +23.48% |
| 6M Return ⓘ | +21.30% | +20.93% |
| Price vs. 200-Day MA ⓘ | +8.65% | +7.43% |
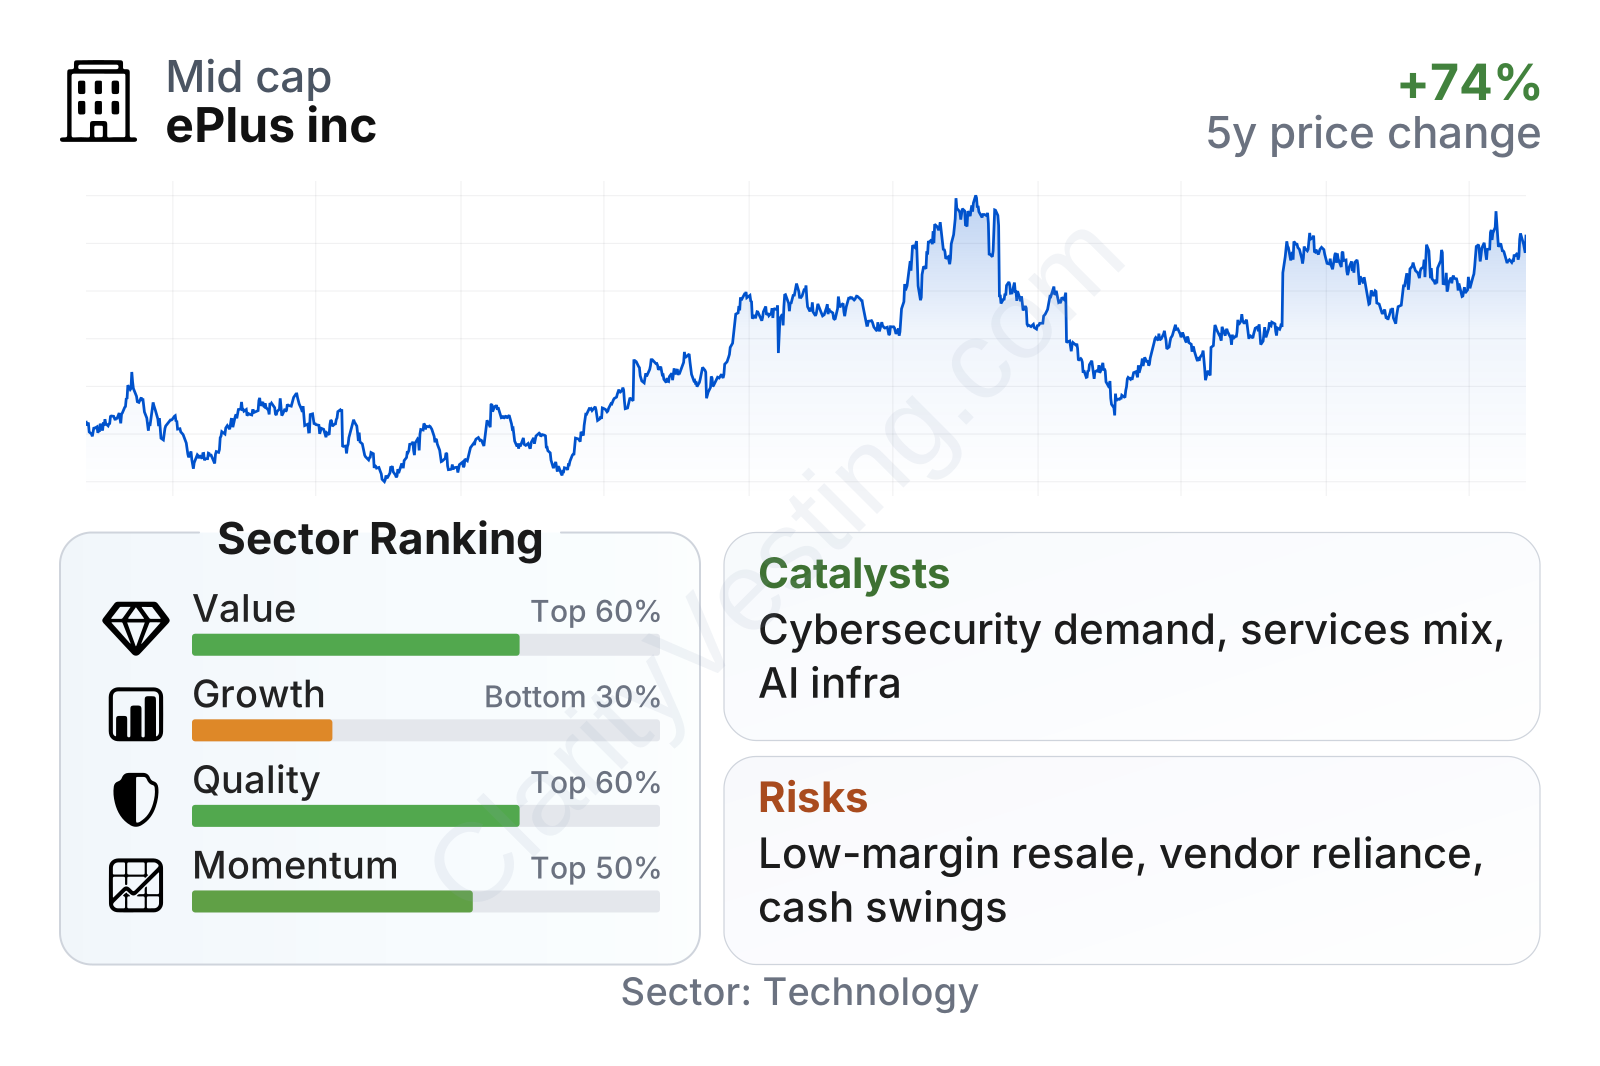
ePlus is a mid-sized technology company with a stock that has been volatile but has still moved materially higher over the past several years. The latest metrics point to a mixed profile: valuation looks lighter than much of the broader technology sector, balance-sheet quality is notably strong, but growth ranks weaker than many peers. Returns on invested capital are healthy, and the company carries very little leverage, yet margins remain below the sector median and recent earnings growth has been uneven.
This combination helps explain why the market does not award ePlus the same earnings multiple as many software names. It has some solid business-quality traits, but its revenue mix and margin structure are more typical of a solutions reseller and services provider than a high-margin software platform.
Growth
The sector backdrop is favorable in broad terms. Companies and government agencies continue to spend on cloud migration, cybersecurity, AI-ready infrastructure, networking upgrades, and hybrid work tools. These are long-duration themes rather than short-lived fads, and they align well with ePlus’s role as an advisor, reseller, and implementation partner.
The company’s strategy also makes sense for future expansion. ePlus is trying to capture more wallet share from existing customers by combining product sales with design, integration, managed services, and financing. That matters because services and recurring support can make customer relationships stickier and can reduce reliance on one-time hardware transactions.
Recent growth has not been linear. Revenue growth was strong in several earlier periods, then turned negative in some quarters, and has reaccelerated more recently. The latest trailing picture is modest on a year-over-year basis, which is why the company ranks in the lower part of the sector on growth metrics. Still, the underlying annual results for the fiscal year ended March 2026 were stronger, with total revenue reaching a new high and profits recovering as customer demand improved.
Cash generation deserves a careful reading. Free cash flow has swung sharply from negative to strongly positive and back to negative over the last several years. For a business like ePlus, that does not automatically signal deterioration because working capital can move a lot when product volumes, inventory, receivables, or payment timing change. Even so, it does mean growth is not translating into consistently smooth cash conversion.
A meaningful catalyst is the company’s exposure to areas where customers often need outside expertise rather than just a commodity purchase. Cybersecurity, cloud architecture, AI infrastructure readiness, and managed services can all support demand for more complex solution bundles. ePlus has also highlighted vendor partnerships and technical certifications as part of its go-to-market approach, which can help it compete for larger and more specialized projects.
Another recent positive sign is that fiscal 2026 showed a rebound in operating income and net income after a weaker fiscal 2025. That suggests the company was able to convert stronger activity into better bottom-line performance, not just higher sales volume.
Risks
This article is for informational purposes only and does not constitute financial advice. Some content is AI-generated. See Disclaimer


