Stock Analysis · Pagaya Technologies Ltd (PGY)
Overview
Pagaya Technologies Ltd is a financial technology company that uses artificial intelligence and large-scale data analysis to help banks, credit card issuers, auto finance companies, and other lending partners approve more loans. In simple terms, Pagaya does not primarily act like a traditional bank that keeps large amounts of loans on its own balance sheet. Instead, it builds technology that evaluates consumer credit applications, helps originating partners find additional borrowers they may have declined under older models, and then connects those loans to institutional investors that want exposure to consumer credit.
The business sits at the intersection of software, credit underwriting, and capital markets. That mix matters because Pagaya’s results depend not only on the quality of its technology, but also on the willingness of lending partners to send applications through its system and on the appetite of investors to buy the loans or securities linked to those loans. The company has expanded from personal loans into auto, point-of-sale, real estate, and other credit products, which broadens its addressable market.
Based on company filings, investor materials, and the way Pagaya reports its activities, its revenue is mainly tied to fees and economics generated from facilitating and managing loan flow through its network rather than from traditional net interest income. The broad revenue mix can be described as follows:
- Network volume and transaction-related revenue: approximately 60% to 75% of revenue in recent periods. This includes economics earned when loans are originated through Pagaya-powered programs and placed with funding vehicles or capital partners.
- Contract fees, servicing, and management-related revenue: approximately 15% to 30%. This incorporates fees linked to operating the platform, managing assets, and ongoing program activity.
- Other revenue sources: approximately 5% to 15%. This can include fair-value-related items, ancillary program revenue, and smaller product lines depending on the reporting period.
Those ranges are more useful than a single fixed percentage because Pagaya’s accounting can move with origination volume, capital markets conditions, and fair-value changes. What stands out is that the company is fundamentally a platform business built around loan production, underwriting models, and institutional funding access.
Over the last several years, revenue has climbed from roughly $446 million in 2021 to about $1.26 billion in 2025, while gross profit also improved materially. Operating discipline has become more visible as selling and administrative costs have fallen as a share of revenue, helping the company move from operating losses to positive operating income by 2024 and positive net income by 2025.
The flow of the business shows a meaningful improvement in scale and cost efficiency. Revenue and gross profit have expanded strongly since 2021, while operating expenses have grown much more slowly, especially in selling and administrative costs. That shift is one of the clearest signs that Pagaya’s platform can become more profitable as volume increases.
Key Figures
| Metric | Value | Sector ⓘ |
|---|---|---|
| Date | Sep 12, 2026 | |
| Context | ||
| Sector | Technology | |
| Industry | Software - Infrastructure | |
| Market Cap ⓘ | $1.69B | |
| Beta ⓘ | 5.37 | |
Value (Cheapness) | ||
| P/E Ratio ⓘ | 14.40 | 29.51 |
| FCF Yield ⓘ | 14.87% | 4.25% |
| EBIT / EV ⓘ | 6.95% | 2.85% |
| PEG ⓘ | 0.04 | |
Growth (Business expansion) | ||
| Revenue Growth ⓘ | 18.60% | 15.40% |
| RPS Growth (5Y CAGR) ⓘ | -13.72% | 8.56% |
| EPS Growth (5Y CAGR) ⓘ | N/A | -11.88% |
| Margin Growth (5Y Trend) ⓘ | N/A | 0.46% |
| FCF Growth (5Y CAGR) ⓘ | 51.03% | 9.80% |
Quality (Business durability) | ||
| ROIC (Latest) ⓘ | 8.79% | 9.44% |
| ROIC (5Y Median) ⓘ | -1.43% | 8.30% |
| Net Debt / EBIT (Latest) ⓘ | 6.67 | 0.54 |
| Net Debt / EBIT (5Y Median) ⓘ | N/A | 0.44 |
| Operating Margin (Latest) ⓘ | 7.45% | 9.58% |
| Operating Margin (5Y Median) ⓘ | -7.74% | 8.25% |
| Debt to Equity (Latest) ⓘ | 152.71% | 33.33% |
| Profit Margin (Latest) ⓘ | 9.12% | 7.14% |
| Free Cash Flow (Latest) ⓘ | $251.78M | |
Momentum (Price trend) | ||
| 3Y Return ⓘ | -14.22% | +45.48% |
| 12M Return (excl. last month) ⓘ | -35.63% | +23.48% |
| 6M Return ⓘ | +83.04% | +20.93% |
| Price vs. 200-Day MA ⓘ | +15.46% | +7.43% |
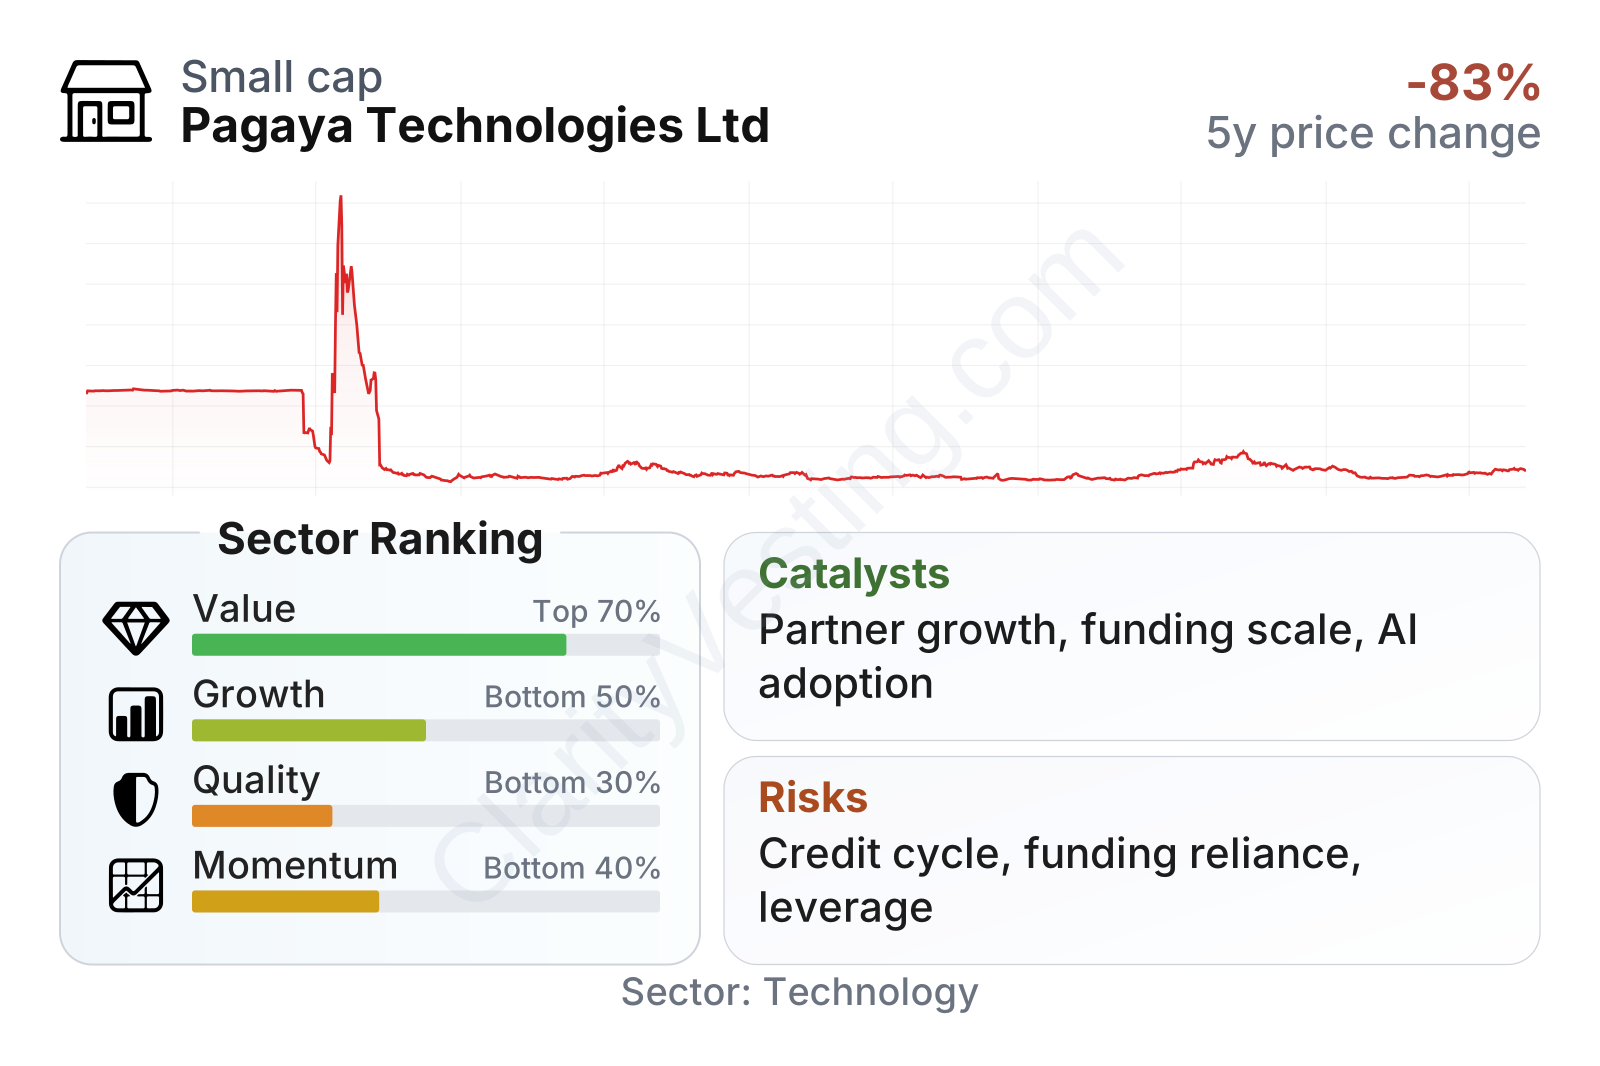
Pagaya is a mid-sized company with a stock that has been highly volatile, reflected in a very elevated beta. The stock’s long-term price record has been much weaker than the broader software sector, even though the business has recently shown stronger profitability and cash generation. On valuation measures, the company screens cheaper than the sector median, with a price-to-earnings ratio in the low teens versus a much higher sector median and an unusually strong free cash flow yield. Growth is more mixed: recent year-over-year revenue growth remains above the sector median, but the longer five-year trend is less impressive because the company went through a difficult period before recovering. Quality indicators also look mixed, with current profit margin ahead of the sector median but leverage still noticeably heavier than typical software peers.
Growth
Pagaya operates in a sector with long-term growth potential. Consumer and specialty lending are becoming more data-driven, and lenders increasingly want tools that can improve approval rates without taking blind risk. That creates room for platforms that can show better underwriting precision, especially in segments where traditional credit scores do not capture the full picture. Pagaya’s strategy fits that trend: it aims to become the infrastructure layer that helps lenders approve more loans while simultaneously giving institutional investors access to diversified consumer credit exposure.
Its expansion into multiple lending verticals also strengthens the growth case. Personal loans remain important, but auto finance, point-of-sale lending, and other adjacent categories create more opportunities to use the same underlying decisioning and funding infrastructure. That can support growth without requiring the company to rebuild the platform from scratch for every new product.
Growth has not been perfectly smooth, but the pattern remains constructive. Revenue growth was exceptionally high in 2022, slowed in 2023, reaccelerated in 2024 and parts of 2025, and then moderated again in early 2026. Even with that cooling, recent growth is still above the sector median. For a company tied to credit markets, some variability is normal, because loan demand, underwriting standards, and investor funding conditions all move over time.
Free cash flow is one of the more encouraging signals. After turning negative during a difficult stretch, Pagaya has produced a sharp rebound, reaching well above $200 million on a trailing basis by early 2026. That matters because it suggests the business is not only growing revenue but also improving the amount of cash it retains after operating needs and investment spending. For long-term analysis, that is more meaningful than growth alone.
A major catalyst is the company’s growing network effect. Each additional lending partner can send more applications into the platform, and each additional funding relationship can increase capacity to absorb loan volume. If Pagaya continues to prove that its models can expand approvals while maintaining acceptable credit performance, that could deepen relationships with existing partners and attract new ones. Another potential catalyst is broader adoption of AI-based underwriting in financial services, where many incumbents are still early in modernization.
Recent company communications have also emphasized continued network expansion, product diversification, and ongoing access to capital markets funding. For Pagaya, that combination is important: stronger demand from originators has limited value if institutional funding capacity is not there to support it. When both sides of the network are growing together, the model becomes much more powerful.
Risks
This article is for informational purposes only and does not constitute financial advice. Some content is AI-generated. See Disclaimer


