Stock Analysis · Penske Automotive Group Inc (PAG)
Overview
Penske Automotive Group is a large transportation retail and services company. Its best-known activity is selling new and used vehicles through dealership franchises, but the business is broader than a typical car dealer. It also earns recurring revenue from vehicle servicing and repairs, finance and insurance products arranged at the dealership, commercial truck retailing, and its majority-owned Premier Truck Group operations. The company also owns a sizable distribution business in Australia and New Zealand through Penske Transportation Solutions and related operations, giving it exposure beyond U.S. auto retail.
The business model is built on high revenue volume and relatively thin margins. That is common in vehicle retailing: the sticker price of vehicles drives large sales totals, while a meaningful share of profit often comes from parts, service, and finance-related activities rather than the initial vehicle sale.
Based on the company’s recent annual reporting structure, the main revenue sources are approximately:
- Retail automotive new vehicle sales: about 60% to 65% of revenue. This is the sale of new cars and light trucks across luxury and mass-market brands.
- Retail automotive used vehicle sales: about 20% to 25% of revenue. This includes used cars sold through the dealership network.
- Commercial truck dealership and related transportation operations: about 8% to 12% of revenue. This includes heavy-duty and medium-duty truck retailing and related services.
- Parts and service: about 8% to 10% of revenue. This includes maintenance, repairs, collision work, and replacement parts. This category is usually far more profitable than its revenue share suggests.
- Finance and insurance: about 2% to 4% of revenue. This includes arranging loans, leases, and protection products for customers.
- Other: a small remainder from distribution, fleet-related, and miscellaneous operations.
Penske’s revenue mix shows why the company can look unusual at first glance: vehicle sales dominate the top line, but service, parts, and finance activities are critical for earnings stability. Over the last several years, revenue expanded meaningfully, but a rising cost base and softer profitability have reduced how much of each sales dollar reaches the bottom line.
The broad pattern is clear: total revenue has risen from the mid-$20 billion range to above $30 billion, while gross profit has held up relatively well. However, selling and administrative costs have also climbed, and net income has moved lower from peak levels. That points to a company still generating large scale and solid gross profit, but with less margin cushion than it had during the unusually strong post-pandemic dealership environment.
Key Figures
| Metric | Value | Sector ⓘ |
|---|---|---|
| Date | Sep 12, 2026 | |
| Context | ||
| Sector | Consumer Cyclical | |
| Industry | Auto & Truck Dealerships | |
| Market Cap ⓘ | $14.18B | |
| Beta ⓘ | 0.83 | |
Value (Cheapness) | ||
| P/E Ratio ⓘ | 15.75 | 17.10 |
| FCF Yield ⓘ | 4.18% | 8.53% |
| EBIT / EV ⓘ | 6.57% | 6.46% |
| PEG ⓘ | 2.18 | |
Growth (Business expansion) | ||
| Revenue Growth ⓘ | 6.00% | 5.75% |
| RPS Growth (5Y CAGR) ⓘ | 10.66% | 9.14% |
| EPS Growth (5Y CAGR) ⓘ | -25.32% | -18.21% |
| Margin Growth (5Y Trend) ⓘ | -1.87% | -0.23% |
| FCF Growth (5Y CAGR) ⓘ | -11.16% | 4.91% |
Quality (Business durability) | ||
| ROIC (Latest) ⓘ | 9.46% | 12.61% |
| ROIC (5Y Median) ⓘ | 17.45% | 10.72% |
| Net Debt / EBIT (Latest) ⓘ | 5.97 | 2.10 |
| Net Debt / EBIT (5Y Median) ⓘ | 3.70 | 2.32 |
| Operating Margin (Latest) ⓘ | 4.67% | 9.25% |
| Operating Margin (5Y Median) ⓘ | 5.51% | 9.64% |
| Debt to Equity (Latest) ⓘ | 158.59% | 75.78% |
| Profit Margin (Latest) ⓘ | 2.81% | 5.33% |
| Free Cash Flow (Latest) ⓘ | $592.10M | |
Momentum (Price trend) | ||
| 3Y Return ⓘ | +45.38% | +14.53% |
| 12M Return (excl. last month) ⓘ | +24.53% | +3.08% |
| 6M Return ⓘ | +48.93% | +0.55% |
| Price vs. 200-Day MA ⓘ | +24.87% | -0.54% |
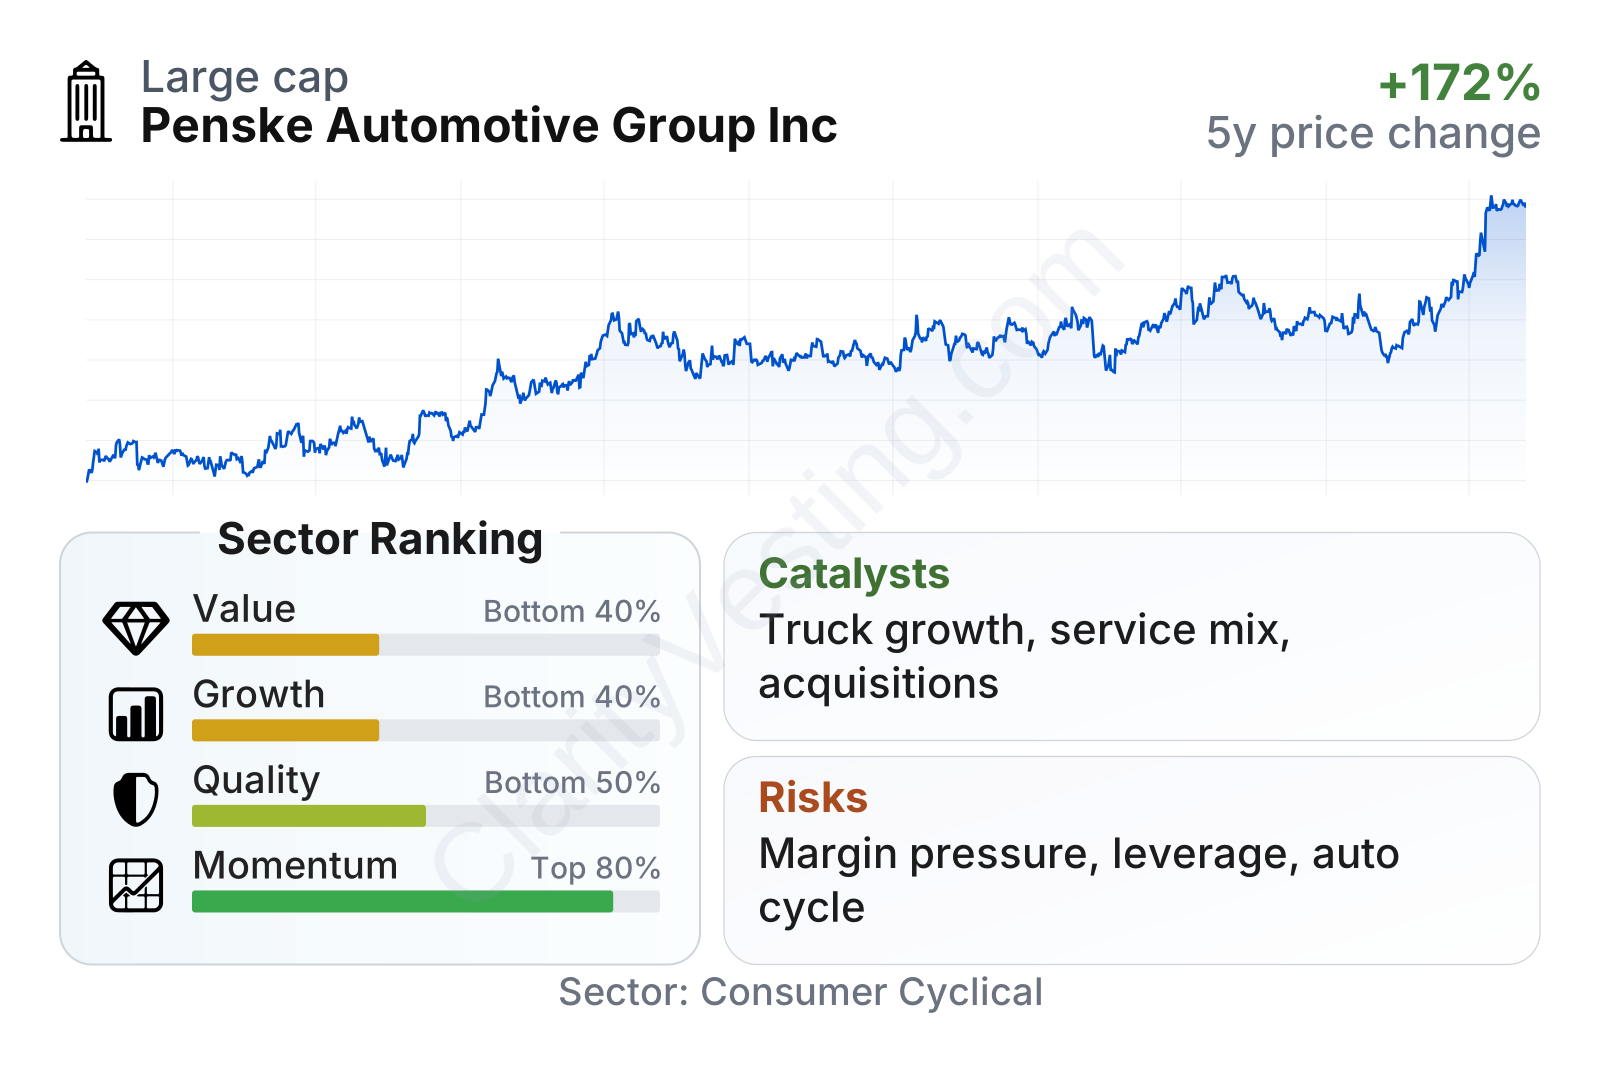
Penske is a large public company with a market value in the low tens of billions of dollars and a stock volatility below the broader market, based on its beta under 1. The stock’s multi-year performance has been strong, with gains over three years well ahead of the sector median, and recent price momentum has also been favorable.
The table points to a mixed fundamental profile. On valuation, the earnings multiple is below the sector median, which suggests the market is not assigning a premium despite the company’s scale. On the other hand, free cash flow yield is weaker than the sector median, and the PEG ratio indicates the current multiple is not especially cheap if growth remains modest.
Quality and growth rankings sit in the lower part of the sector. Recent return on invested capital is below the sector median, margins are thinner than peers, and leverage is elevated. Revenue growth has been decent, but earnings and free cash flow trends over five years have been weaker than the sector, which helps explain why the stock does not command a richer valuation.
Growth
The company operates in a sector that should keep growing over time, though not in a straight line. Vehicle retail benefits from long-term drivers such as population growth, household vehicle replacement, an aging car parc that needs service, and increasing complexity in vehicles that supports higher service and repair spending. Heavy truck retail and service can also grow with freight activity, fleet renewal, and tighter emissions and efficiency standards.
Penske’s strategy is sensible for long-term expansion because it is not relying on a single growth engine. It combines premium automotive dealerships, used vehicles, aftersales service, commercial trucks, and international distribution. That mix matters. New vehicle sales are cyclical, but parts, service, and finance activities tend to be steadier. Commercial truck operations add another lane for growth that is not perfectly tied to the same demand pattern as luxury auto retail.
Revenue growth has remained positive more often than not, although it has clearly become less consistent than during the 2021-2023 period. The recent rebound toward double-digit year-over-year growth is encouraging because it suggests the company is still finding ways to expand despite a tougher retail environment. Over a five-year view, revenue per share growth has outpaced the sector median, which supports the case that Penske has been able to scale its platform effectively.
The weaker point is cash generation. Free cash flow remains positive, but the trend has moved down from well above $1 billion to around $600 million on a trailing basis. That does not suggest stress on its own, but it does indicate less financial flexibility than in earlier years. For a dealership group, this matters because acquisitions, inventory funding, buybacks, and dividends all compete for capital.
Potential catalysts are tied less to a single breakthrough product and more to execution and industry normalization. If vehicle supply remains healthy, dealerships can sell more units even without extraordinary pricing. If used vehicle margins stabilize and service demand stays firm, earnings can become more balanced. Penske’s scale also leaves room for additional acquisitions of dealerships or transportation assets, a strategy it has used for years to expand its footprint.
Recent company reporting has also highlighted ongoing brand mix optimization and disciplined capital allocation. In practical terms, that means recycling capital toward franchises and geographies where returns are stronger. That is a meaningful lever in an industry where local market position and brand quality can materially influence results.
Risks
This article is for informational purposes only and does not constitute financial advice. Some content is AI-generated. See Disclaimer


