Stock Analysis · OReilly Automotive Inc (ORLY)
Overview
O’Reilly Automotive is one of the largest auto parts retailers in the United States. The company sells replacement parts, tools, equipment, and accessories used to repair and maintain vehicles. Its customers include both do-it-yourself drivers and professional repair shops, which gives the business exposure to everyday maintenance as well as more steady repeat demand from commercial garages.
The business model is relatively easy to understand: O’Reilly operates a large store network, supported by distribution centers and inventory systems designed to get parts to customers quickly. In auto parts, speed and product availability matter a lot. A repair shop often needs the right component the same day, and O’Reilly’s dense network helps it compete on service rather than only on price.
Revenue is mainly generated from product sales across broad categories rather than from subscriptions or complex financial activities. Based on company disclosures and the structure of the aftermarket parts business, sales are broadly driven by the following areas:
- Replacement parts and maintenance items: the largest revenue source, likely the clear majority of sales. This includes engine parts, brakes, batteries, filters, fluids, and other repair essentials.
- Professional service garage sales: a major channel within total revenue, typically representing a large share of business because repair shops order frequently and value fast delivery.
- Do-it-yourself retail sales: still meaningful, but generally smaller than the professional segment as the company has expanded its commercial business.
- Accessories, tools, and equipment: a smaller contribution, including items such as tools, appearance products, and shop supplies.
What stands out is the consistency of the model. People may delay buying a new car, but they still need to keep existing vehicles running. That gives O’Reilly a business tied less to new vehicle sales and more to the installed base of cars already on the road. Over the last several years, revenue, gross profit, operating income, and net income have all moved higher overall, showing a retailer that has been able to grow while keeping unusually strong profitability for its sector.
The business mix shows a favorable pattern: sales have expanded steadily, gross profit has grown with them, and earnings have also trended upward. Interest expense has risen as debt costs increased, but it has remained manageable relative to operating income.
Key Figures
| Metric | Value | Sector ⓘ |
|---|---|---|
| Date | Jul 18, 2026 | |
| Context | ||
| Sector | Consumer Cyclical | |
| Industry | Auto Parts | |
| Market Cap ⓘ | $71.48B | |
| Beta ⓘ | 0.51 | |
Value (Cheapness) | ||
| P/E Ratio ⓘ | 26.95 | 18.58 |
| FCF Yield ⓘ | 2.68% | 7.99% |
| EBIT / EV ⓘ | 4.64% | 5.91% |
| PEG ⓘ | 1.77 | |
Growth (Business expansion) | ||
| Revenue Growth ⓘ | 10.20% | 5.50% |
| RPS Growth (5Y CAGR) ⓘ | 11.58% | 9.20% |
| EPS Growth (5Y CAGR) ⓘ | -28.62% | -26.43% |
| Margin Growth (5Y Trend) ⓘ | -2.42% | -0.18% |
| FCF Growth (5Y CAGR) ⓘ | -12.87% | 5.02% |
Quality (Business durability) | ||
| ROIC (Latest) ⓘ | 55.84% | 12.03% |
| ROIC (5Y Median) ⓘ | 64.18% | 10.82% |
| Net Debt / EBIT (Latest) ⓘ | 2.37 | 2.12 |
| Net Debt / EBIT (5Y Median) ⓘ | 2.37 | 2.25 |
| Operating Margin (Latest) ⓘ | 19.64% | 9.28% |
| Operating Margin (5Y Median) ⓘ | 20.15% | 9.64% |
| Debt to Equity (Latest) ⓘ | -818.25% | 75.23% |
| Profit Margin (Latest) ⓘ | 14.30% | 5.28% |
| Free Cash Flow (Latest) ⓘ | $1.91B | |
Momentum (Price trend) | ||
| 3Y Return ⓘ | +34.12% | +10.68% |
| 12M Return (excl. last month) ⓘ | -0.45% | +5.26% |
| 6M Return ⓘ | -8.11% | -2.41% |
| Price vs. 200-Day MA ⓘ | -8.34% | +1.55% |
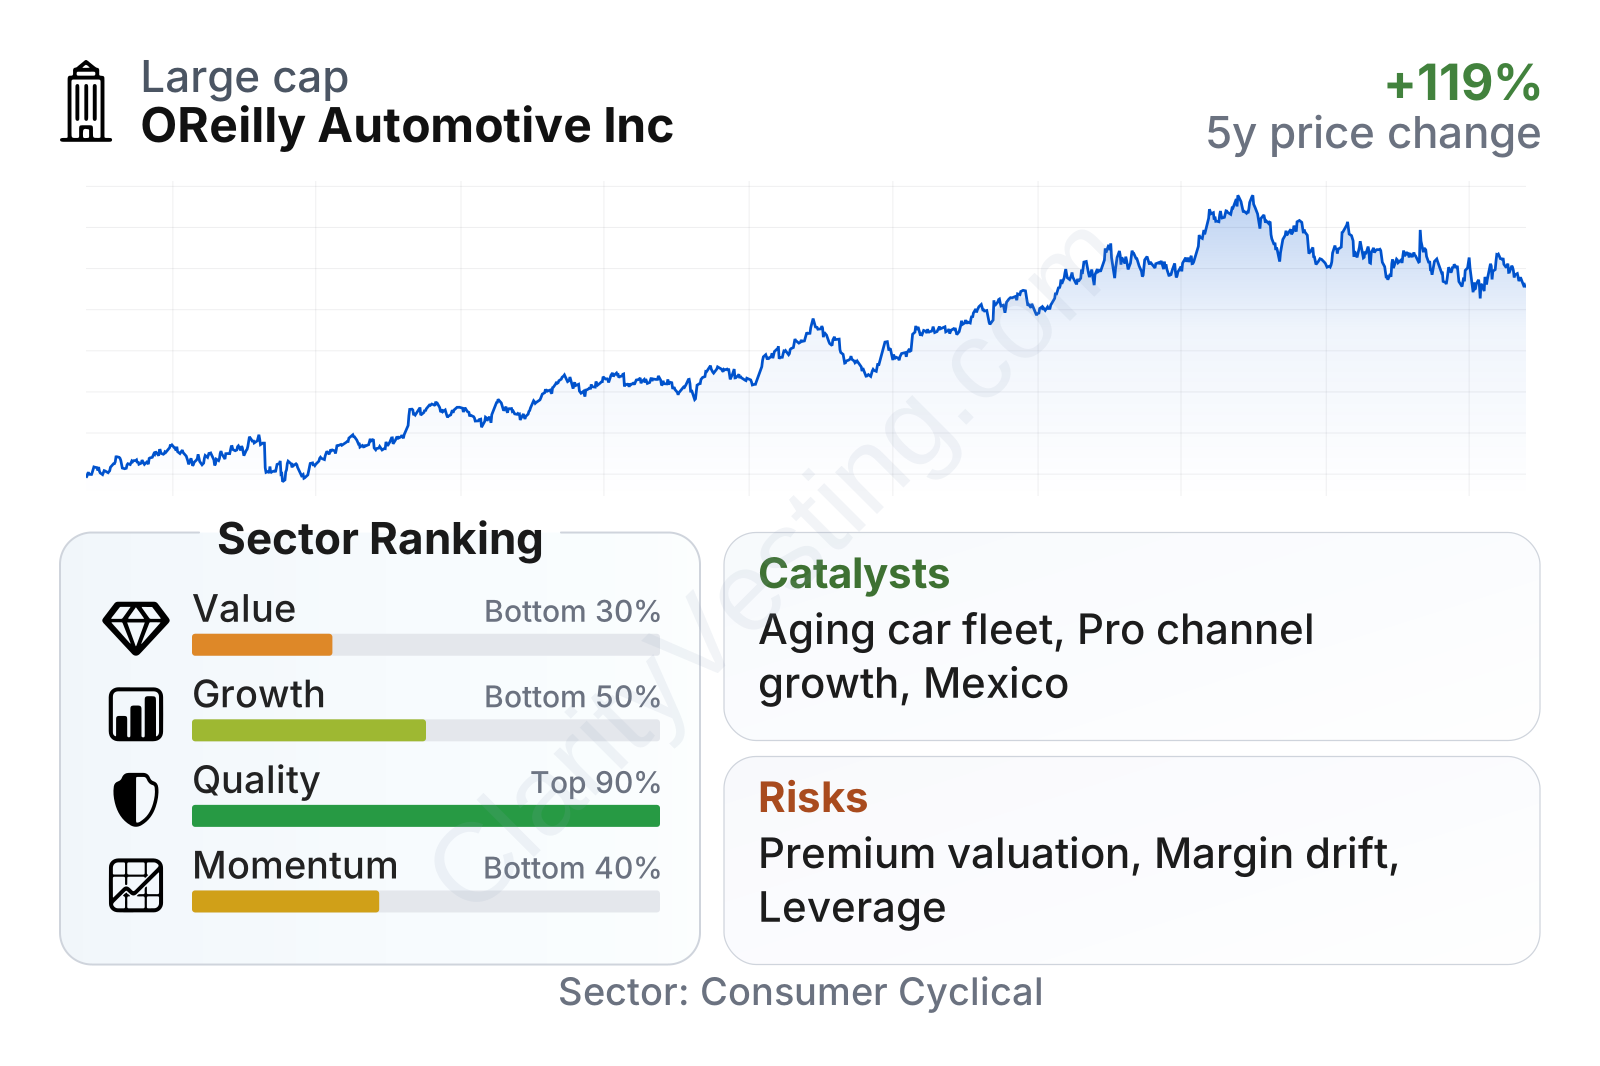
O’Reilly stands out most on business quality. Profitability is well above the sector median, with operating and net margins far stronger than many consumer cyclical peers. Return on invested capital is especially notable, pointing to a company that has historically converted its store base, distribution network, and inventory discipline into strong earnings power.
On growth, the picture is more mixed. Revenue growth remains healthy and has recently run above the sector median, but free cash flow and margin trends have softened compared with earlier periods. On valuation, the stock trades at a premium multiple versus the sector, which means the market is already recognizing the company’s strengths. Recent price momentum has also been softer than the longer-term record, even though the multi-year share performance remains solid.
At roughly a large-cap scale and with a below-market beta, O’Reilly combines size, resilience, and relatively lower share-price volatility than many cyclical names. That does not remove risk, but it helps explain why the market often treats the company as a higher-quality retailer.
Growth
The auto aftermarket is generally considered a durable growth area rather than a high-speed expansion industry. Its appeal comes from resilience. As vehicles age, they need more repairs and replacement parts. In the United States, the average age of vehicles has continued to rise, which supports demand for companies like O’Reilly. Even when consumers become more cautious, they often keep older vehicles longer, which can increase maintenance needs.
O’Reilly’s strategy fits this environment well. The company keeps expanding its store base, invests in distribution capacity, and strengthens its professional customer relationships. That commercial business is important because repair shops place recurring orders and depend on reliability. The company also benefits from scale in purchasing, inventory breadth, and logistics, which are difficult for smaller rivals to match.
Revenue growth has remained positive through different market conditions and recently re-accelerated into the low-double-digit range. That is a constructive sign for a mature retailer, especially because it compares favorably with the broader sector. It suggests O’Reilly is still finding room to gain share rather than merely riding industry demand.
Free cash flow remains substantial, although it has come down from earlier peaks. For a long-term business analysis, that matters because store expansion, inventory investment, and shareholder returns all depend on cash generation. The current level still points to a business producing meaningful cash, but not with the same margin of expansion seen several years ago.
A meaningful catalyst is the continued aging of the vehicle fleet, which tends to raise demand for replacement parts. Another is market share opportunity in the professional segment, where fast delivery and broad inventory create switching costs. The company has also continued opening stores and investing in supply chain efficiency, which can extend its geographic reach and improve service levels. In addition, electric vehicles are often discussed as a threat to traditional parts retailers, but the transition is likely to be gradual because the installed base of gasoline-powered vehicles remains very large and will require maintenance for years.
Recent company updates have continued to emphasize new store growth, distribution investments, and demand from both professional and retail customers. None of that points to a dramatic short-term breakthrough, but it does reinforce the idea of a business still compounding through execution rather than depending on a single transformative event.
Risks
O’Reilly has real competitive advantages, but it also operates in a demanding industry. Its strengths include scale, brand recognition, dense store coverage, strong parts availability, and a well-developed distribution system. Those features support fast service and can make the company a preferred supplier for repair shops. This is one reason O’Reilly is viewed as one of the leaders in the auto parts retail market alongside AutoZone, Advance Auto Parts, and Genuine Parts’ NAPA business.
The company appears especially strong on execution and profitability when compared with several major rivals. AutoZone is its closest peer in quality and scale. Genuine Parts is more diversified and has large industrial operations beyond auto parts. Advance Auto Parts has been under more operational pressure in recent years. Relative to that competitive set, O’Reilly’s margins and returns have remained among the strongest, which suggests it is well placed rather than merely participating in a crowded market.
The main business risk is that this is still a retail and distribution operation with exposure to costs, labor, inventory management, and local competition. If same-store sales slow while wages, occupancy, and freight expenses rise, margins can come under pressure. That concern is worth watching because the margin trend, while still excellent in absolute terms, has eased from earlier highs.
The debt-to-equity figure looks unusual because O’Reilly has negative shareholder equity, largely a result of years of aggressive share repurchases rather than a conventional sign of distress. That means debt-to-equity is not very useful here by itself. A better lens is debt relative to earnings, and on that basis leverage appears manageable, though not low. Rising interest costs are worth monitoring, especially if borrowing costs stay elevated.
Profit margin has gradually narrowed from the mid-teens to the low-teens, but it remains far above the sector median. In other words, O’Reilly is still highly profitable; the risk is more about compression from very strong levels than outright weakness. If operating costs rise faster than sales, this gap could narrow further.
Another long-term risk is industry change. Electric vehicles typically require fewer traditional maintenance items such as oil-related products, which could alter parts demand over time. That said, the shift is likely to be slow and uneven, and many categories sold by O’Reilly remain relevant across vehicle types. Execution risk also matters: poor inventory decisions, slower delivery times, or weaker service to professional customers could hurt market share in a business where reliability is central.
There have been no widely recognized recent events pointing to scandal, severe governance breakdown, or a major reputation shock based on official company disclosures. The more relevant risks remain operational and competitive rather than headline-driven.
Valuation
O’Reilly’s valuation reflects a high-quality company rather than a bargain profile. The earnings multiple is clearly above the sector median, and that premium has persisted for years.
The pattern is consistent: the stock has usually traded at a higher P/E than the broader sector, and the current level remains in that elevated range. That premium is not hard to understand. O’Reilly has delivered stronger margins, stronger returns on capital, and steadier execution than many consumer cyclical peers. In that sense, the valuation is tied to business quality and resilience.
The more difficult question is how much future growth is already reflected in the price. Revenue growth is still solid, but this is not a hyper-growth business. Free cash flow has also been softer than earlier peaks, and margin trends are no longer improving. That makes the current valuation look demanding rather than obviously disconnected from fundamentals. In simple terms, the stock price appears to assume that O’Reilly can continue operating as an industry leader with very strong profitability and steady share gains.
So the valuation context is best described as premium and quality-driven. It is easier to justify than that of a weak business trading at a high multiple, but it also leaves less room for disappointment if growth slows or margins weaken further.
Conclusion
O’Reilly Automotive is a straightforward business with an unusually strong operating profile. It sells essential parts into a large and durable market, benefits from aging vehicles, and has built a network that is hard to replicate quickly. Its profitability, returns on capital, and competitive positioning place it near the top of its peer group, which explains why the market has consistently valued it above many other retail and consumer cyclical names.
The main challenge is not whether the business is good, but whether future performance can keep matching a valuation that already reflects a lot of confidence. Revenue growth remains healthy, cash generation is still meaningful, and the company continues to expand, but margin pressure, leverage, and a slowly changing vehicle landscape deserve attention.
Overall, O’Reilly looks like a durable industry leader with strong structural advantages and a financial profile that remains impressive even as some trends have become less favorable. The central debate is less about business quality and more about how much of that quality is already recognized in the current price.
Sources:
- O’Reilly Automotive, Inc. — Annual Report on Form 10-K for fiscal year 2025
- O’Reilly Automotive, Inc. — Quarterly Report on Form 10-Q for quarter ended March 31, 2026
- SEC EDGAR — O’Reilly Automotive, Inc. filings
- O’Reilly Automotive Investor Relations — earnings releases and investor presentations
- O’Reilly Automotive, Inc. — company website corporate and business overview materials
- Wikipedia — O’Reilly Auto Parts
- S&P Global Mobility — public reports on average vehicle age in the United States
This article is for informational purposes only and does not constitute financial advice. Some content is AI-generated. See Disclaimer


