Stock Analysis · Universal Display (OLED)
Overview
Universal Display is a materials and intellectual property company focused on OLED technology, the display format used in many premium smartphones, TVs, wearables, tablets, automotive screens, and some emerging lighting applications. Rather than manufacturing finished consumer devices, the company develops and sells specialized organic materials used inside OLED displays and licenses its patent portfolio to display makers and other industry participants.
Its business model is attractive because it combines recurring material sales with royalty and license income tied to the use of its technology. In simple terms, when OLED production rises, Universal Display can benefit both from higher shipments of materials and from broader use of its patented inventions.
The latest annual reporting shows revenue coming mainly from two large buckets, with a smaller contribution from other items.
- Material sales: about 77% of 2025 revenue. This includes phosphorescent emitter materials and other OLED materials sold to display manufacturers for use in production.
- Royalty and license fees: about 21% of 2025 revenue. This reflects payments from customers that use Universal Display’s OLED intellectual property under long-term agreements.
- Contract research services and other revenue: about 2% of 2025 revenue. This includes collaborative development work and smaller miscellaneous sources.
The overall economic profile is unusually strong for a company of its size. Revenue has moved up over the last several years, while gross profit has remained very high, showing the advantages of a technology and licensing model over a heavy manufacturing model. At the same time, research and development spending has also increased, which is important because future growth depends on keeping the technology pipeline ahead of competitors.
Over the last five full years, revenue rose from the mid-$500 million range to around $650 million, while operating income and net income also remained high. Cost of revenue grew more slowly than sales over most of the period, which helps explain why profitability has stayed well above typical sector levels.
Key Figures
| Metric | Value | Sector ⓘ |
|---|---|---|
| Date | Sep 12, 2026 | |
| Context | ||
| Sector | Technology | |
| Industry | Electronic Components | |
| Market Cap ⓘ | $3.84B | |
| Beta ⓘ | 1.56 | |
Value (Cheapness) | ||
| P/E Ratio ⓘ | 19.61 | 29.51 |
| FCF Yield ⓘ | 4.43% | 4.25% |
| EBIT / EV ⓘ | 6.31% | 2.85% |
| PEG ⓘ | 1.23 | |
Growth (Business expansion) | ||
| Revenue Growth ⓘ | -11.40% | 15.40% |
| RPS Growth (5Y CAGR) ⓘ | 3.96% | 8.56% |
| EPS Growth (5Y CAGR) ⓘ | -22.31% | -11.88% |
| Margin Growth (5Y Trend) ⓘ | -3.03% | 0.46% |
| FCF Growth (5Y CAGR) ⓘ | -0.54% | 9.80% |
Quality (Business durability) | ||
| ROIC (Latest) ⓘ | 9.90% | 9.44% |
| ROIC (5Y Median) ⓘ | 14.91% | 8.30% |
| Net Debt / EBIT (Latest) ⓘ | -0.50 | 0.54 |
| Net Debt / EBIT (5Y Median) ⓘ | -0.29 | 0.44 |
| Operating Margin (Latest) ⓘ | 34.07% | 9.58% |
| Operating Margin (5Y Median) ⓘ | 42.02% | 8.25% |
| Debt to Equity (Latest) ⓘ | 1.00% | 33.33% |
| Profit Margin (Latest) ⓘ | 32.24% | 7.14% |
| Free Cash Flow (Latest) ⓘ | $170.02M | |
Momentum (Price trend) | ||
| 3Y Return ⓘ | -45.75% | +45.48% |
| 12M Return (excl. last month) ⓘ | -33.33% | +23.48% |
| 6M Return ⓘ | -10.83% | +20.93% |
| Price vs. 200-Day MA ⓘ | -15.10% | +7.43% |
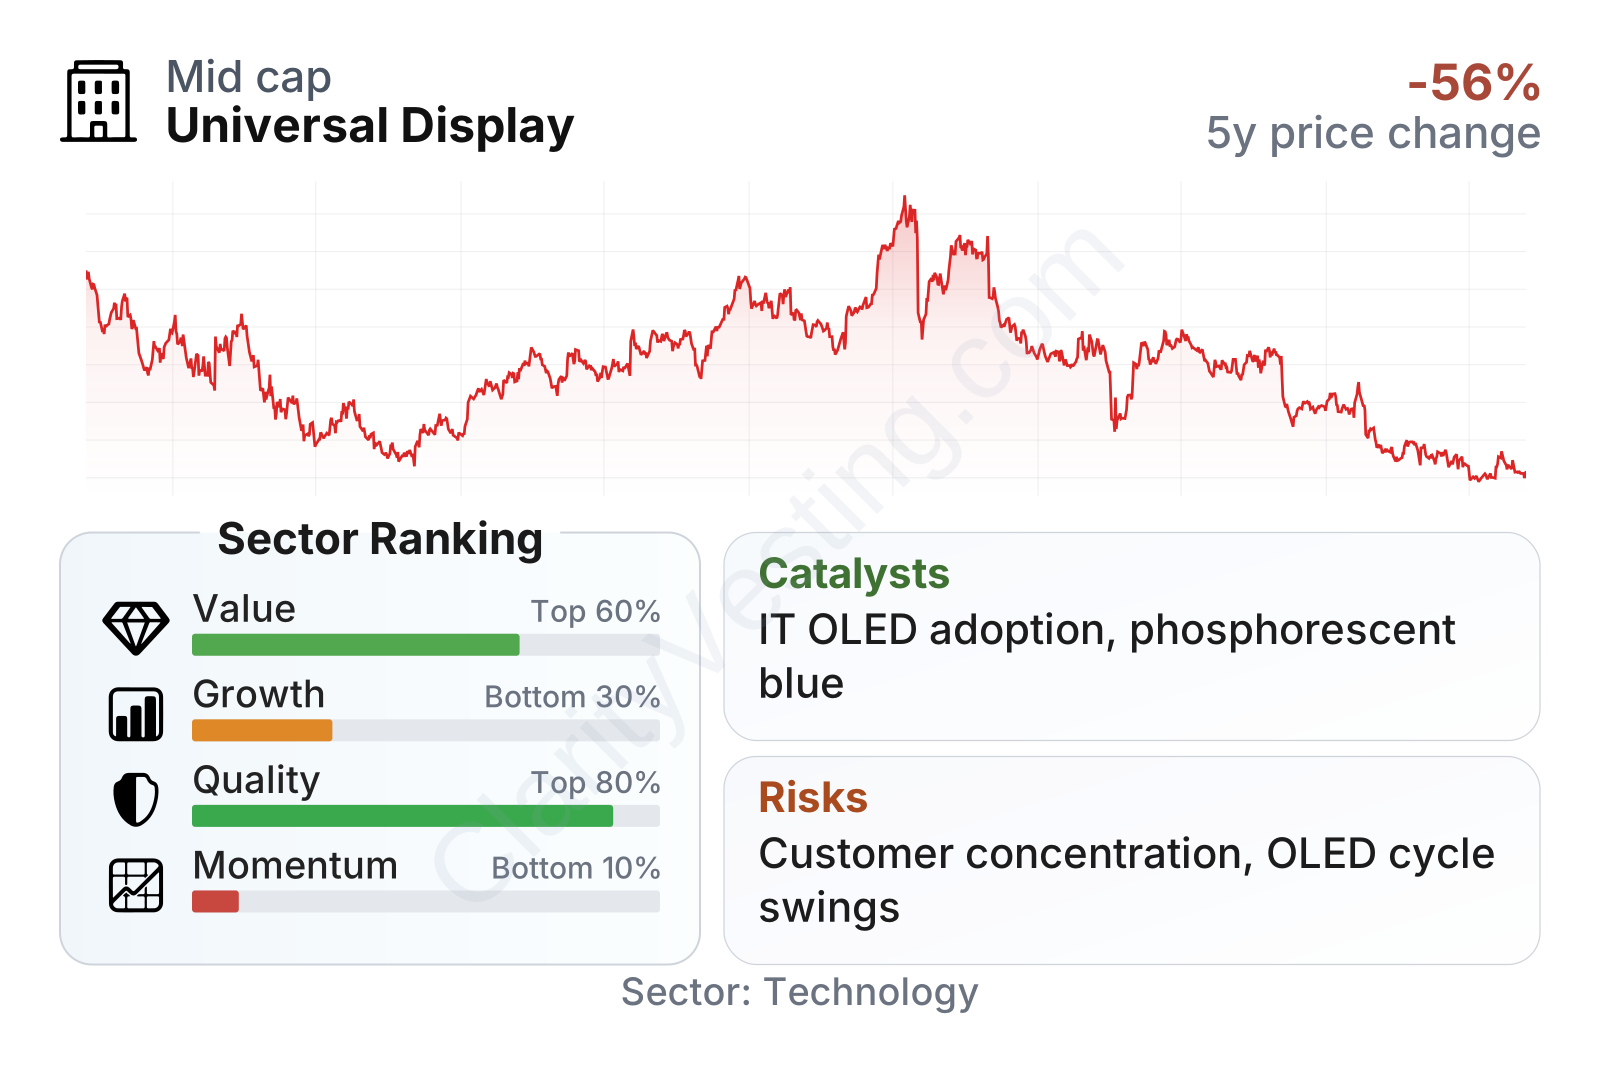
Universal Display stands out more for business quality than for recent growth or stock performance. Profitability is far above the sector median, returns on invested capital are solid, and the balance sheet is exceptionally conservative with very little debt and net cash. On valuation, the earnings multiple sits below the sector median, which makes the shares look less demanding than many technology names. The weak spots are recent revenue momentum and share-price momentum, both of which have lagged the broader sector.
The stock history also shows a business that the market has repeatedly re-rated. Shares reached much higher levels in 2021, then went through a long reset as growth slowed and sentiment around display demand weakened. That matters for long-term analysis because it shows that even a strong company can trade with high volatility when customers delay production or consumer electronics demand cools.
Growth
Universal Display operates in a sector with real long-term expansion potential. OLED screens continue to spread across more device categories because they offer strong contrast, thin form factors, power-efficiency advantages in many use cases, and flexible design possibilities. The company’s strategy fits that trend: instead of trying to build factories, it focuses on owning key technology, supplying specialized materials, and deepening customer relationships with major panel makers.
A major long-term catalyst is broader OLED penetration beyond flagship smartphones. Larger opportunities include IT devices such as tablets, laptops, and monitors, continued adoption in premium TVs, and rising use in vehicles where curved, thinner, and higher-quality displays are becoming more common. If OLED capacity expands across these categories, Universal Display could participate with both material volume and royalty streams.
Another important growth driver is technology improvement. The company has been investing heavily in next-generation OLED materials, especially phosphorescent blue. Blue has been one of the most technically challenging parts of the OLED stack, and a commercially successful phosphorescent blue system could improve efficiency and strengthen Universal Display’s position with panel makers. Management has also continued to discuss an expanded materials portfolio, which matters because the more components it supplies, the larger its content per display can become.
Recent growth has not been smooth. Year-over-year revenue has swung between strong gains and clear declines, reflecting the cyclical nature of the display supply chain and customer order timing. The latest readings are negative, so near-term momentum is weaker than the broader technology sector. That does not break the long-term thesis, but it does show that this is not a straight-line growth business.
Cash generation has improved meaningfully from the softer period in 2023 and 2024. Trailing free cash flow has recovered to a level close to the company’s stronger historical range, which suggests the business still converts a large portion of its earnings into cash when demand conditions normalize.
Recent company communications in 2026 have continued to emphasize OLED adoption in IT and the progress of the company’s phosphorescent blue efforts. Those themes matter more than any single quarter because they point to possible future content growth per device and to expansion into categories where OLED penetration is still relatively early.
Risks
This article is for informational purposes only and does not constitute financial advice. Some content is AI-generated. See Disclaimer


