Stock Analysis · Nexstar Broadcasting Group Inc (NXST)
Overview
Nexstar Broadcasting Group is one of the largest local television station owners in the United States. The company operates television stations affiliated with major broadcast networks, distributes local and national news, sells advertising, and earns fees from cable, satellite, and virtual pay-TV distributors that carry its stations. It also owns national media assets, including The CW network, NewsNation, multicast networks, and a portfolio of digital media properties. In simple terms, Nexstar makes money by combining local TV reach with national content and then charging advertisers and distributors for access to that audience.
Its revenue base is diversified, but still centered on television economics. Based on recent company reporting, the main sources of revenue are approximately:
- Distribution revenue: about 52% to 56% — fees paid by cable, satellite, and streaming TV distributors for the right to carry Nexstar’s local stations and related programming.
- Advertising revenue: about 24% to 30% — local and national advertising sold on broadcast stations and digital platforms. This category can swing sharply during election years because political advertising can add a large temporary boost.
- Political advertising: about 8% to 15% in strong election periods, and much lower in off-cycle periods — campaign spending on local television is an important but highly cyclical source of revenue.
- Network and other revenue: about 10% to 15% — includes revenue tied to The CW, multicast networks, content distribution, and other media-related activities.
Nexstar’s business mix matters because distribution fees tend to be more stable than advertising, while political advertising can create sharp peaks in certain years. That makes the company less dependent on one single income stream than a traditional broadcaster, but still exposed to the ups and downs of the ad market and election cycle.
The long-term financial pattern has been uneven rather than linear. Revenue reached a high point in 2024, then eased in 2025, while profit dropped much more sharply than sales because margins were squeezed. Interest expense has stayed heavy throughout the period, which shows how much the capital structure influences final earnings.
Key Figures
| Metric | Value | Sector ⓘ |
|---|---|---|
| Date | Sep 12, 2026 | |
| Context | ||
| Sector | Communication Services | |
| Industry | Broadcasting | |
| Market Cap ⓘ | $5.21B | |
| Beta ⓘ | 0.89 | |
Value (Cheapness) | ||
| P/E Ratio ⓘ | 32.15 | 18.61 |
| FCF Yield ⓘ | 14.26% | 13.68% |
| EBIT / EV ⓘ | 4.21% | 4.54% |
| PEG ⓘ | 0.29 | |
Growth (Business expansion) | ||
| Revenue Growth ⓘ | 62.20% | 5.40% |
| RPS Growth (5Y CAGR) ⓘ | 11.13% | 4.62% |
| EPS Growth (5Y CAGR) ⓘ | -20.89% | -18.01% |
| Margin Growth (5Y Trend) ⓘ | -18.92% | 1.10% |
| FCF Growth (5Y CAGR) ⓘ | -8.59% | 5.88% |
Quality (Business durability) | ||
| ROIC (Latest) ⓘ | 4.87% | 8.38% |
| ROIC (5Y Median) ⓘ | 10.22% | 8.32% |
| Net Debt / EBIT (Latest) ⓘ | 16.79 | 1.99 |
| Net Debt / EBIT (5Y Median) ⓘ | 5.28 | 2.94 |
| Operating Margin (Latest) ⓘ | 10.15% | 14.89% |
| Operating Margin (5Y Median) ⓘ | 25.95% | 12.96% |
| Debt to Equity (Latest) ⓘ | 533.55% | 59.59% |
| Profit Margin (Latest) ⓘ | 3.20% | 8.77% |
| Free Cash Flow (Latest) ⓘ | $743.00M | |
Momentum (Price trend) | ||
| 3Y Return ⓘ | +29.39% | +46.64% |
| 12M Return (excl. last month) ⓘ | -5.00% | +2.16% |
| 6M Return ⓘ | -27.91% | +5.05% |
| Price vs. 200-Day MA ⓘ | -13.55% | +2.88% |
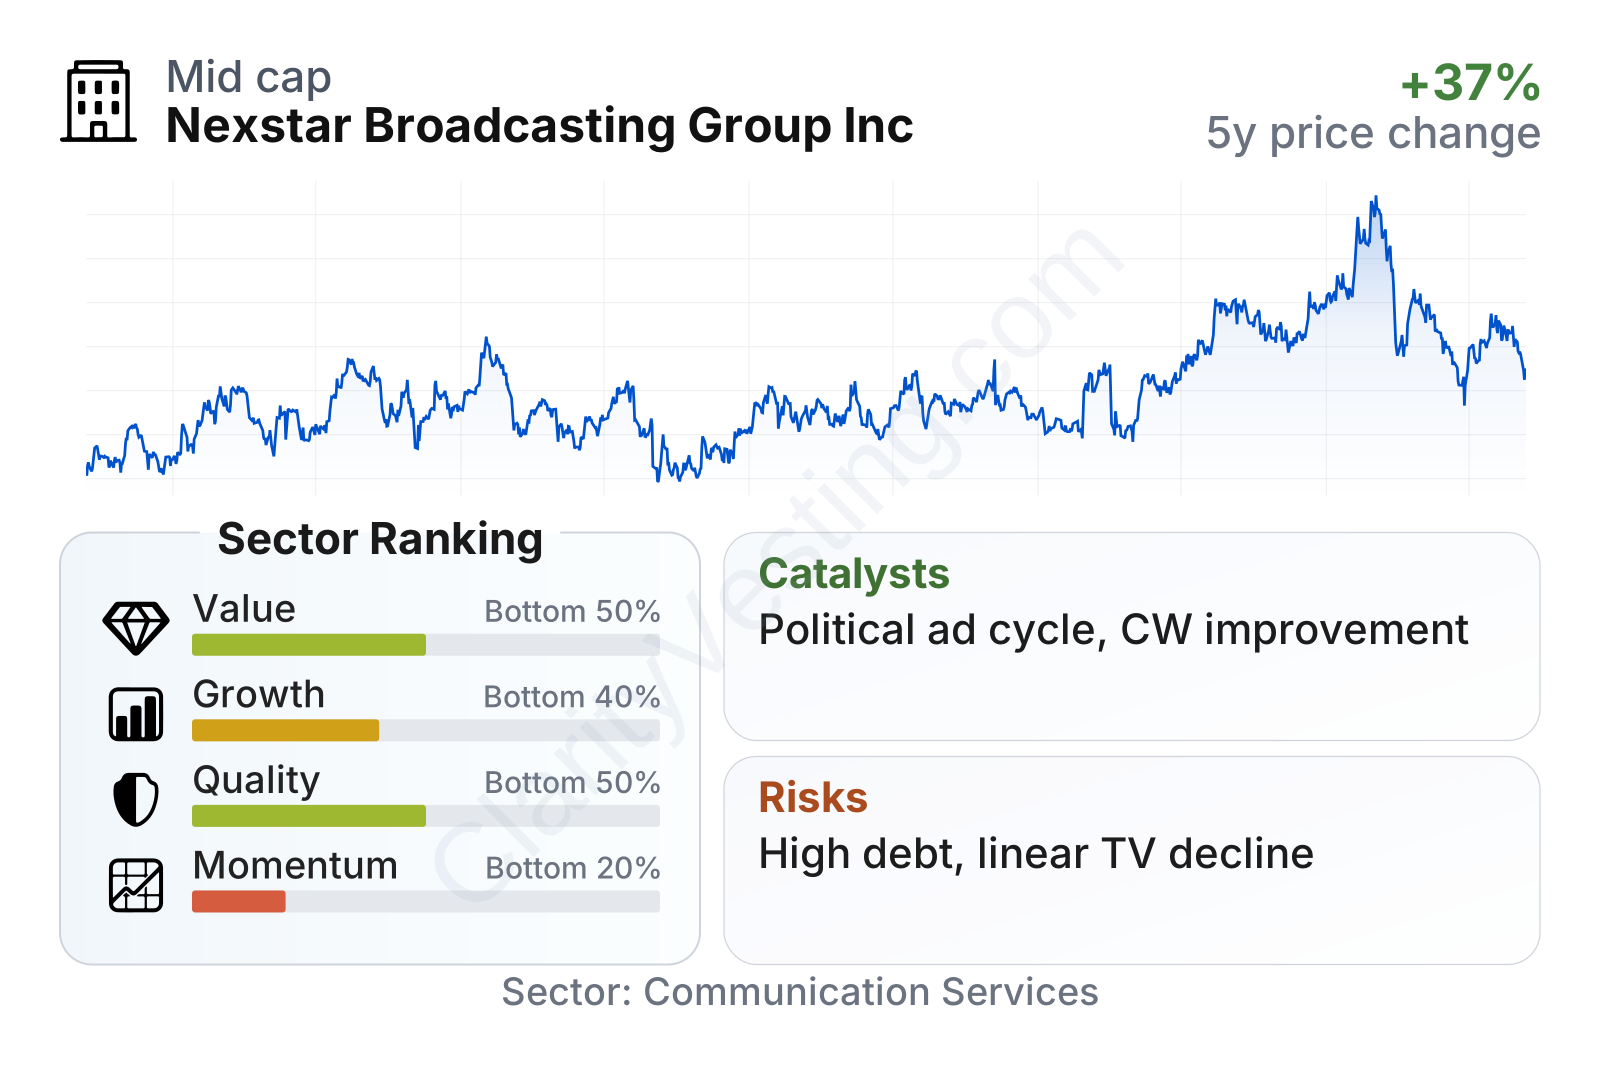
Nexstar sits in the mid-cap range and its share-price volatility is not unusually high for a media company, with beta slightly below 1. The table points to a mixed profile. On one hand, free cash flow generation remains meaningful, with a free cash flow yield above the sector median. On the other hand, value metrics look less favorable if judged only by the current earnings multiple, and growth and momentum rankings are weak relative to the broader communication services group.
The most important takeaway is that Nexstar currently looks stronger on cash generation than on accounting earnings. That distinction matters because recent net profit has been pressured, while cash flow has remained more resilient. It also helps explain why the stock’s valuation can look expensive on a P/E basis while appearing more reasonable on cash-flow-based measures.
Growth
Nexstar operates in a mature sector, not a classic high-growth industry. Traditional broadcast television faces long-term audience fragmentation as viewers continue shifting toward streaming and digital platforms. However, local news and live events remain valuable because they are harder to replace than general entertainment. That gives Nexstar a better growth profile than some weaker broadcasters, especially because local stations still have strong reach in many U.S. markets and remain useful to political advertisers.
The company’s strategy for future growth is logical, even if it is not transformational. Management has been building a broader media portfolio beyond local stations, with national assets such as The CW and NewsNation, while also pushing digital distribution and ad sales. The central idea is to use Nexstar’s scale in local broadcasting to support wider content distribution and extract more value from both advertisers and carriage partners. This approach may help offset pressure from slower structural trends in linear television, though it does not fully remove that pressure.
Revenue growth has been highly cyclical rather than steady. Strong jumps have tended to come from election-related advertising and easier comparisons, while weaker periods have reflected softer advertising demand and the normal post-election reset. The latest year-over-year rebound is notable, but for Nexstar it should be read carefully because one or two strong quarters do not automatically signal a durable change in the long-term growth path.
Free cash flow is one of the more constructive parts of the picture. Even with visible fluctuations, Nexstar has continued to generate substantial cash over time, often near or above the billion-dollar level on a trailing basis in stronger periods. That gives the company financial flexibility for dividends, debt reduction, and selective investment. It also means the business still throws off real cash despite pressure on headline profit.
A major catalyst remains the U.S. political advertising cycle. Local television has historically attracted significant campaign spending, and Nexstar’s station footprint gives it broad exposure to that pattern. Another potential opportunity is continued improvement at The CW, where management has been working to reshape programming and economics. If the company can improve network performance while keeping retransmission revenue resilient, the combination would support a more balanced earnings base.
Recent company updates have also highlighted distribution renewals, digital expansion, and ongoing work to improve national assets. None of these alone changes the industry’s direction, but together they point to a strategy focused on preserving cash generation while creating modest new growth paths.
Risks
This article is for informational purposes only and does not constitute financial advice. Some content is AI-generated. See Disclaimer


