Stock Analysis · NetApp Inc (NTAP)
Overview
NetApp is a technology company focused on data storage, data management, and cloud data services. In simple terms, it helps businesses store large amounts of information, protect it, move it between their own data centers and public clouds, and keep it available for applications such as databases, analytics, and artificial intelligence workloads. Its products are used by enterprises, government organizations, and service providers that need their data to remain secure, reliable, and easy to access.
The business is built around a mix of hardware, software, and recurring support and subscription revenue. Based on the company’s recent annual reporting structure, revenue is mainly split between hybrid cloud products and public cloud services, with the hybrid cloud segment still representing the clear majority of sales. Within hybrid cloud, all-flash storage systems, software, maintenance, and related services are the core building blocks. Public cloud revenue comes from software and services that help customers manage and protect data across cloud platforms.
The main revenue sources can be summarized as follows.
- Hybrid Cloud: approximately 87% of total revenue. This includes NetApp’s storage systems, especially all-flash arrays, associated software, support, and professional services used in customer-owned or colocation environments.
- Public Cloud: approximately 13% of total revenue. This includes cloud-native storage, data services, backup, governance, and operational tools sold through hyperscale cloud environments and subscriptions.
- Product revenue within the total mix: roughly in the mid-50% range in recent years, largely from systems and software licenses or bundled platform sales.
- Support and services revenue within the total mix: roughly in the mid-40% range, providing a steadier recurring base tied to maintenance contracts, subscriptions, and customer support.
Geographically, NetApp is diversified across the Americas, Europe, the Middle East and Africa, and Asia-Pacific, which reduces reliance on a single country or customer group. Its customer base also tends to be enterprise-oriented, which usually means longer relationships and high switching costs once storage systems are deeply integrated into day-to-day operations.
Financially, the business has become more efficient over time. Revenue has moved up gradually over the last several years, while gross profit and operating income have improved faster than sales, showing better cost discipline and a richer mix of software and flash-based products.
The broad trend is encouraging: revenue has climbed from about $6.3 billion to nearly $6.9 billion over the last five fiscal years shown, while operating income has risen more sharply. That suggests NetApp is not just growing, but also extracting better profitability from each dollar of sales.
Key Figures
| Metric | Value | Sector ⓘ |
|---|---|---|
| Date | Sep 12, 2026 | |
| Context | ||
| Sector | Technology | |
| Industry | Software - Infrastructure | |
| Market Cap ⓘ | $39.14B | |
| Beta ⓘ | 1.43 | |
Value (Cheapness) | ||
| P/E Ratio ⓘ | 28.11 | 29.51 |
| FCF Yield ⓘ | 4.22% | 4.25% |
| EBIT / EV ⓘ | 5.61% | 2.85% |
| PEG ⓘ | 2.04 | |
Growth (Business expansion) | ||
| Revenue Growth ⓘ | 29.90% | 15.40% |
| RPS Growth (5Y CAGR) ⓘ | 5.98% | 8.56% |
| EPS Growth (5Y CAGR) ⓘ | -26.10% | -11.88% |
| Margin Growth (5Y Trend) ⓘ | 6.45% | 0.46% |
| FCF Growth (5Y CAGR) ⓘ | 17.37% | 9.80% |
Quality (Business durability) | ||
| ROIC (Latest) ⓘ | 40.82% | 9.44% |
| ROIC (5Y Median) ⓘ | 33.00% | 8.30% |
| Net Debt / EBIT (Latest) ⓘ | 0.49 | 0.54 |
| Net Debt / EBIT (5Y Median) ⓘ | 0.38 | 0.44 |
| Operating Margin (Latest) ⓘ | 26.59% | 9.58% |
| Operating Margin (5Y Median) ⓘ | 21.17% | 8.25% |
| Debt to Equity (Latest) ⓘ | 169.50% | 33.33% |
| Profit Margin (Latest) ⓘ | 19.18% | 7.14% |
| Free Cash Flow (Latest) ⓘ | $1.65B | |
Momentum (Price trend) | ||
| 3Y Return ⓘ | +169.77% | +45.48% |
| 12M Return (excl. last month) ⓘ | +90.75% | +23.48% |
| 6M Return ⓘ | +107.27% | +20.93% |
| Price vs. 200-Day MA ⓘ | +51.31% | +7.43% |
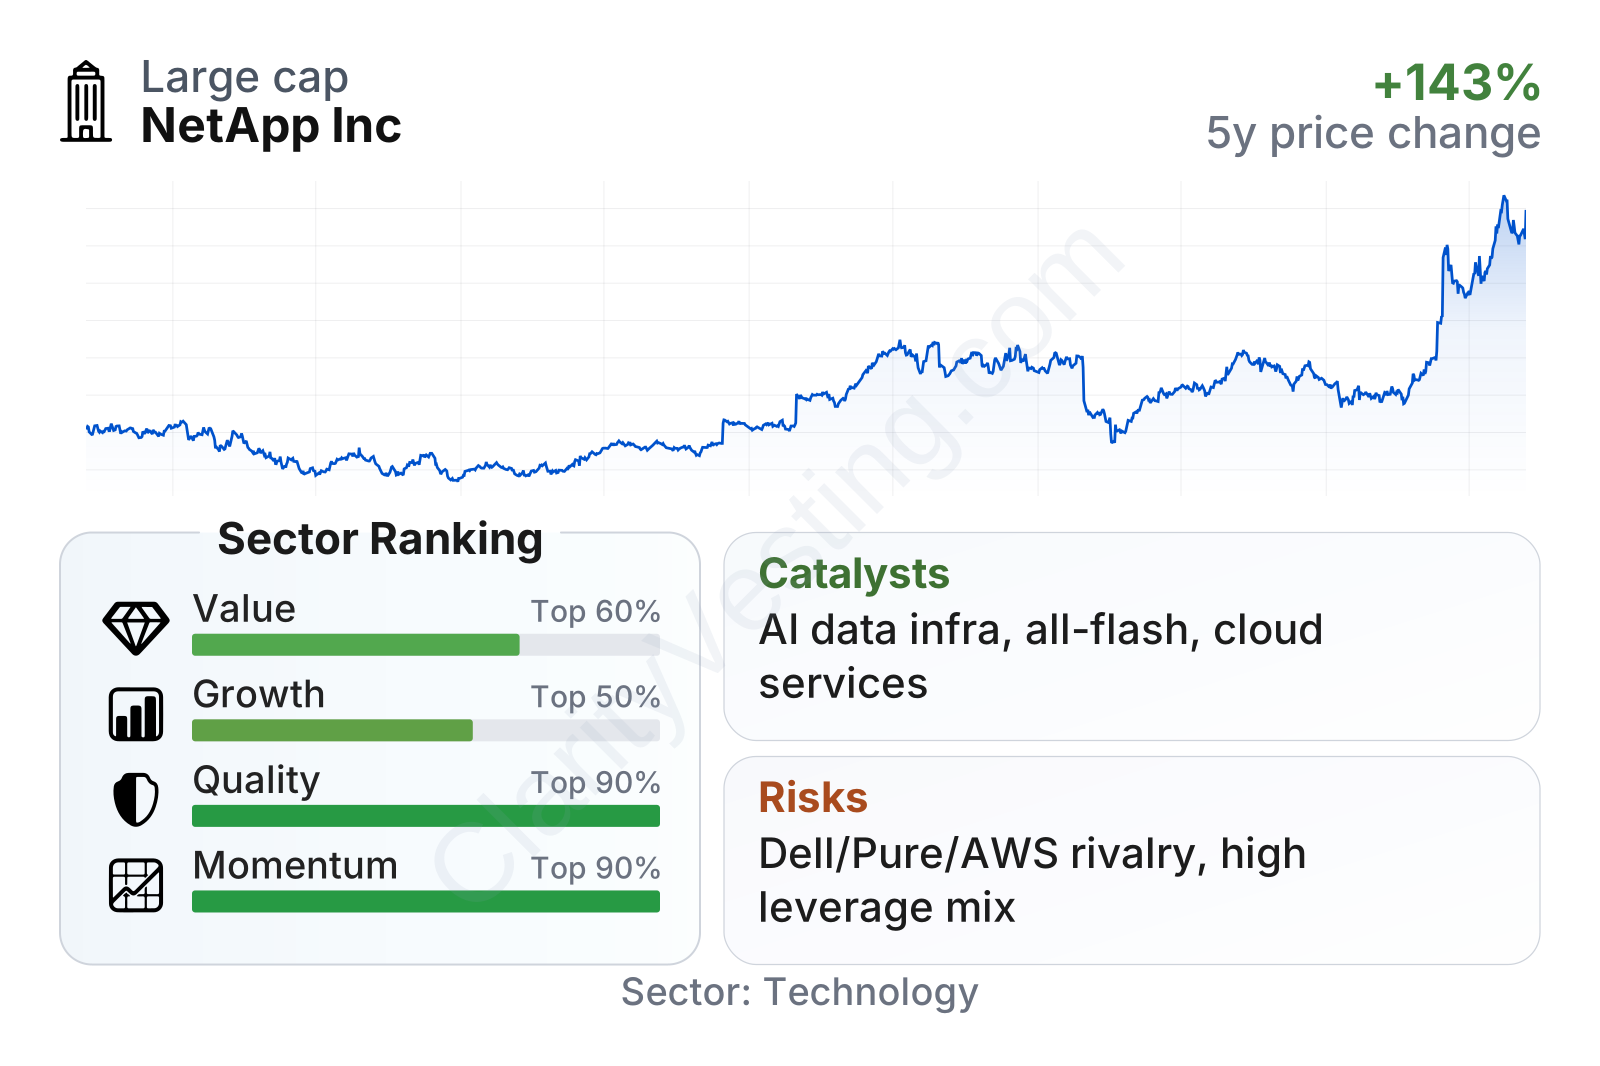
NetApp is a large technology company with above-average share-price volatility, as reflected by a beta around 1.4. The overall profile shown here is notable for very strong quality metrics: returns on invested capital are far above the sector median, operating margin is in the mid-20% range, and profit margin is close to 19%, all of which point to an efficient and disciplined business. Value metrics are not stretched relative to the broader software infrastructure space, with the earnings multiple below the sector median and cash generation comparing well. Growth is more mixed: recent revenue acceleration has been strong, but longer-term per-share growth has been more moderate and earnings growth over five years has been affected by fluctuations. Momentum remains powerful, reflecting a sharp re-rating in the stock over the last few years.
Growth
NetApp operates in a sector with durable long-term demand. Data volumes keep increasing, companies continue shifting workloads to cloud environments, and artificial intelligence applications require fast, reliable, and scalable storage infrastructure. That does not guarantee constant growth every year, but it does support a large and expanding need for the kind of systems and services NetApp provides.
The company’s strategy appears coherent for that environment. Rather than competing only as a traditional storage hardware vendor, NetApp has been positioning itself around hybrid and multi-cloud data management. This matters because many enterprises do not want all their data in one place. They often keep some applications on-premises for performance, compliance, or cost reasons, while using public cloud for flexibility. NetApp’s pitch is that it can help customers manage data across both worlds with less friction.
Recent growth has improved materially. After a weak period in 2023, year-over-year revenue trends turned positive and then accelerated sharply into 2026, reaching close to 30% in the latest reading shown. That is well above the sector median and suggests NetApp is benefiting from better product demand, stronger execution, or both. It is also a reminder that this business can look cyclical in the short term even when its long-term market remains attractive.
Cash generation has strengthened alongside that recovery. Trailing free cash flow has risen from a little above $1.1 billion a few years ago to around $1.6 billion recently. For a long-term business assessment, this is an important signal: strong cash flow gives NetApp room to invest in research, support acquisitions, reduce debt, and return capital to shareholders without depending heavily on outside financing.
One of the clearest catalysts is AI infrastructure demand. NetApp has been emphasizing its role in enterprise AI data pipelines, where large volumes of information need to be stored, accessed quickly, and governed properly. The company has also continued to expand partnerships with major cloud and technology platforms, which can widen its distribution and make its offerings easier to adopt inside broader IT ecosystems.
Another meaningful opportunity comes from the shift toward all-flash storage. Flash systems are faster and often more efficient than older disk-based systems, and NetApp has been pushing this transition for years. If customers continue modernizing their storage environments, NetApp can benefit from both replacement demand and higher-value configurations.
Recent company communications have also highlighted continued progress in public cloud services and cyber-resilience offerings. These areas are strategically important because they add more recurring revenue and make the platform more relevant beyond basic storage hardware.
Risks
This article is for informational purposes only and does not constitute financial advice. Some content is AI-generated. See Disclaimer


