Stock Analysis · NFI Group Inc (NFYEF)
Overview
NFI Group Inc is a North American manufacturer of buses and motor coaches. Through brands such as New Flyer, MCI, Alexander Dennis, ARBOC, and NFI Parts, the company designs, builds, and supports vehicles used by public transit agencies, shuttle operators, and private coach customers. Its products span heavy-duty transit buses, intercity coaches, low-floor cutaway and medium-duty buses, and aftermarket parts and service.
The business is tied closely to public transportation spending. A large share of demand comes from municipal and regional transit authorities replacing aging fleets or adding cleaner vehicles. NFI has also built a meaningful position in zero-emission buses, including battery-electric and fuel-cell models, which matters because fleet decarbonization is becoming a major purchasing driver across North America and parts of the U.K.
Based on company reporting, revenue is mainly generated from the manufacturing and delivery of buses and coaches, with a smaller but strategically important stream from parts and service.
- Transit buses and coaches: approximately 85% to 90% of revenue. This includes New Flyer transit buses, MCI motor coaches, Alexander Dennis buses, and ARBOC vehicles sold to public and private operators.
- Aftermarket parts, service, and support: approximately 10% to 15% of revenue. This includes replacement parts distribution, maintenance support, training, infrastructure-related support, and other recurring services tied to the installed fleet.
The broad pattern in recent years is straightforward: vehicle manufacturing drives most sales, but parts and service usually provide steadier activity and can help margins because they are less tied to the timing of large vehicle deliveries.
The operating picture shows a company that has expanded revenue materially since 2022, but profitability has remained inconsistent. Gross profit recovered strongly through 2024 as production improved, yet interest expense has stayed high and net income has remained under pressure. That makes execution and balance-sheet repair just as important as top-line growth.
Key Figures
| Metric | Value | Sector ⓘ |
|---|---|---|
| Date | Sep 12, 2026 | |
| Context | ||
| Sector | Consumer Cyclical | |
| Industry | Auto Manufacturers | |
| Market Cap ⓘ | $2.03B | |
| Beta ⓘ | 0.54 | |
Value (Cheapness) | ||
| P/E Ratio ⓘ | 37.91 | 17.10 |
| FCF Yield ⓘ | 13.15% | 8.53% |
| EBIT / EV ⓘ | 2.81% | 6.46% |
| PEG ⓘ | N/A | |
Growth (Business expansion) | ||
| Revenue Growth ⓘ | 18.60% | 5.75% |
| RPS Growth (5Y CAGR) ⓘ | -1.98% | 9.14% |
| EPS Growth (5Y CAGR) ⓘ | N/A | -18.21% |
| Margin Growth (5Y Trend) ⓘ | -2.59% | -0.23% |
| FCF Growth (5Y CAGR) ⓘ | N/A | 4.91% |
Quality (Business durability) | ||
| ROIC (Latest) ⓘ | N/A | 12.61% |
| ROIC (5Y Median) ⓘ | 0.48% | 10.72% |
| Net Debt / EBIT (Latest) ⓘ | 12.47 | 2.10 |
| Net Debt / EBIT (5Y Median) ⓘ | 13.00 | 2.32 |
| Operating Margin (Latest) ⓘ | 2.36% | 9.25% |
| Operating Margin (5Y Median) ⓘ | 0.29% | 9.64% |
| Debt to Equity (Latest) ⓘ | 196.71% | 75.78% |
| Profit Margin (Latest) ⓘ | 1.43% | 5.33% |
| Free Cash Flow (Latest) ⓘ | $267.29M | |
Momentum (Price trend) | ||
| 3Y Return ⓘ | +81.49% | +14.53% |
| 12M Return (excl. last month) ⓘ | +29.71% | +3.08% |
| 6M Return ⓘ | +37.69% | +0.55% |
| Price vs. 200-Day MA ⓘ | +18.27% | -0.54% |
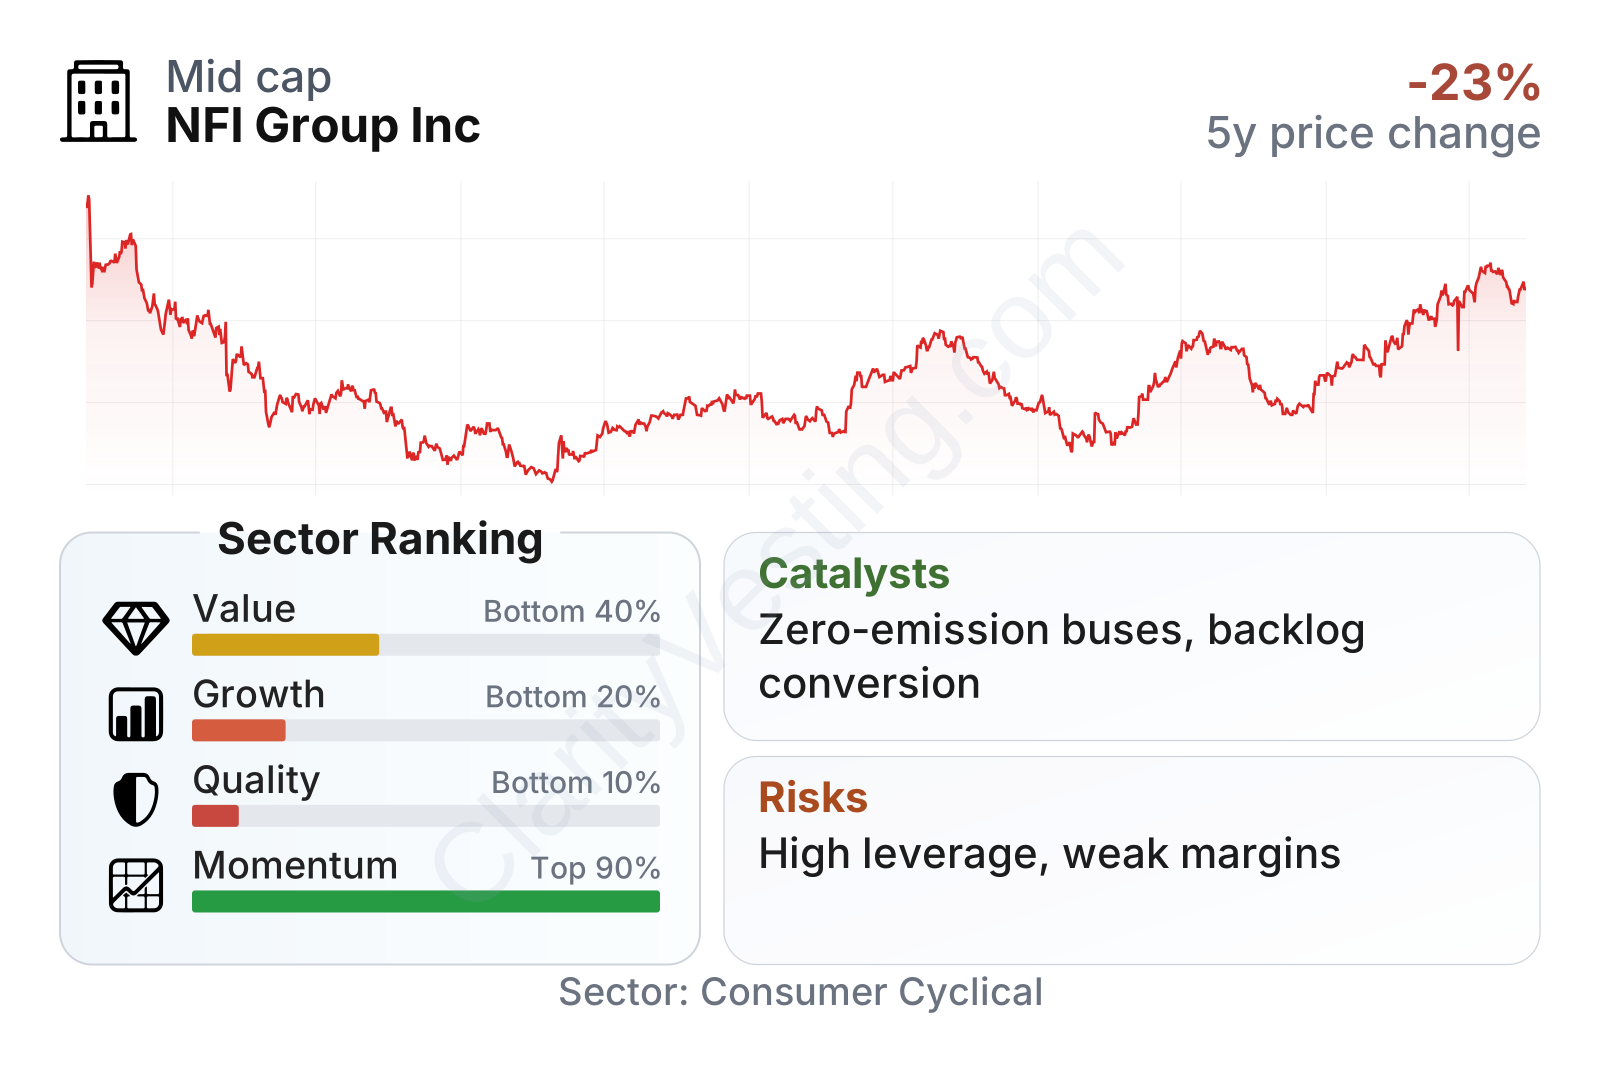
NFI is a mid-sized vehicle manufacturer with a stock that has been far stronger than most of its sector over the last several years. At the same time, the underlying fundamentals remain mixed. Revenue growth has recently outpaced the sector median, but quality and valuation factors rank near the bottom of the sector because margins are weak, leverage is elevated, and cash flow generation is still modest relative to the company’s size. In short, the market has been rewarding the recovery trend faster than the financial profile has fully caught up.
Growth
NFI operates in a sector with credible long-term support. Public transit fleets in North America are aging, governments continue to fund fleet renewal, and decarbonization rules are pushing agencies toward cleaner buses. That creates a structural demand backdrop that is more durable than a typical consumer vehicle cycle. Unlike personal auto demand, public transit orders are often tied to multi-year capital plans and public funding programs.
The company’s strategy also makes industrial sense. NFI is not just trying to sell more buses; it is trying to build a larger installed base that later generates parts, service, training, and lifecycle support revenue. That is attractive because every vehicle delivered can become a recurring revenue opportunity for many years.
Revenue growth has been volatile, which is normal for a manufacturer with large contracts and delivery timing effects. The important point is that the company moved from deep declines in 2021 and 2022 to a strong rebound across much of 2023 through 2025. The most recent quarter showed a slight year-over-year decline, so the recovery is not perfectly smooth, but the broader direction over the last few years has been upward.
A major catalyst is zero-emission transit adoption. NFI has been active in electric and fuel-cell bus platforms for several years, and many transit agencies are still in the early stages of replacing diesel fleets. If those programs continue to scale, established manufacturers with production experience, service networks, and agency relationships are in a stronger position than newer entrants.
Recent company updates have also emphasized backlog, production normalization, and operational improvement initiatives. Those matter because bus manufacturing is highly sensitive to supply chain reliability and factory throughput. When component availability improves, the business can convert backlog into revenue and cash more efficiently.
Cash flow is showing an early but important improvement. Free cash flow was deeply negative in 2023, remained weak in 2024 and early 2025, and then turned positive on a trailing twelve-month basis. That does not prove the turnaround is complete, but it suggests that production recovery is starting to translate into cash rather than only accounting revenue. For a capital-intensive manufacturer with meaningful debt, that shift is one of the most relevant markers to watch.
Risks
This article is for informational purposes only and does not constitute financial advice. Some content is AI-generated. See Disclaimer


