Stock Analysis · Norwegian Cruise Line Holdings Ltd (NCLH)
Overview
Norwegian Cruise Line Holdings Ltd is a cruise company that owns and operates three main brands: Norwegian Cruise Line, Oceania Cruises, and Regent Seven Seas Cruises. Its business is straightforward: it sells cruise vacations that combine transportation, lodging, food, entertainment, and onboard services into one travel product. The company serves a broad range of customers, from mass-market vacation travelers to premium and ultra-luxury guests.
The company’s revenue comes mainly from selling passenger tickets and from spending onboard its ships. Based on recent annual filings, ticket revenue remains the largest source, while onboard and other revenue provides an important additional stream with higher-margin characteristics in many periods.
- Passenger ticket revenue: about 75% to 80% of total revenue. This includes cruise fares and amounts tied to the core vacation package.
- Onboard and other revenue: about 20% to 25% of total revenue. This includes casino activity, beverage packages, specialty dining, shore excursions, spa services, retail, internet, and other guest purchases.
Geographically, Norwegian Cruise Line Holdings sells globally, but demand is heavily tied to North American consumers even though its ships operate across the Caribbean, Europe, Alaska, Asia-Pacific, and other destinations. The group is smaller than the two largest listed cruise rivals, but it has meaningful scale, a recognized brand portfolio, and exposure to higher-end segments through Oceania and Regent.
The business mix also shows how much recovery has taken place since the pandemic years. Revenue has climbed sharply from depressed levels, operating income has turned positive again, and net income recovered before becoming more pressured by financing costs. Even so, interest expense remains unusually important for the final profit picture, which is one of the central themes for evaluating the company over a long horizon.
The long-term pattern is clear: sales rebounded strongly from 2021 through 2024, and operating profitability improved materially, but the path from operating profit to bottom-line earnings remains sensitive to debt costs.
Key Figures
| Metric | Value | Sector ⓘ |
|---|---|---|
| Date | Sep 12, 2026 | |
| Context | ||
| Sector | Consumer Cyclical | |
| Industry | Travel Services | |
| Market Cap ⓘ | $6.81B | |
| Beta ⓘ | 1.88 | |
Value (Cheapness) | ||
| P/E Ratio ⓘ | 8.98 | 17.10 |
| FCF Yield ⓘ | -16.93% | 8.53% |
| EBIT / EV ⓘ | 7.10% | 6.46% |
| PEG ⓘ | 1.22 | |
Growth (Business expansion) | ||
| Revenue Growth ⓘ | 4.90% | 5.75% |
| RPS Growth (5Y CAGR) ⓘ | 86.36% | 9.14% |
| EPS Growth (5Y CAGR) ⓘ | N/A | -18.21% |
| Margin Growth (5Y Trend) ⓘ | 401.82% | -0.23% |
| FCF Growth (5Y CAGR) ⓘ | -22.37% | 4.91% |
Quality (Business durability) | ||
| ROIC (Latest) ⓘ | 10.13% | 12.61% |
| ROIC (5Y Median) ⓘ | 6.47% | 10.72% |
| Net Debt / EBIT (Latest) ⓘ | 9.70 | 2.10 |
| Net Debt / EBIT (5Y Median) ⓘ | 9.03 | 2.32 |
| Operating Margin (Latest) ⓘ | 15.04% | 9.25% |
| Operating Margin (5Y Median) ⓘ | 10.42% | 9.64% |
| Debt to Equity (Latest) ⓘ | 584.36% | 75.78% |
| Profit Margin (Latest) ⓘ | 7.49% | 5.33% |
| Free Cash Flow (Latest) ⓘ | -$1.15B | |
Momentum (Price trend) | ||
| 3Y Return ⓘ | -10.99% | +14.53% |
| 12M Return (excl. last month) ⓘ | -21.95% | +3.08% |
| 6M Return ⓘ | -23.84% | +0.55% |
| Price vs. 200-Day MA ⓘ | -25.11% | -0.54% |
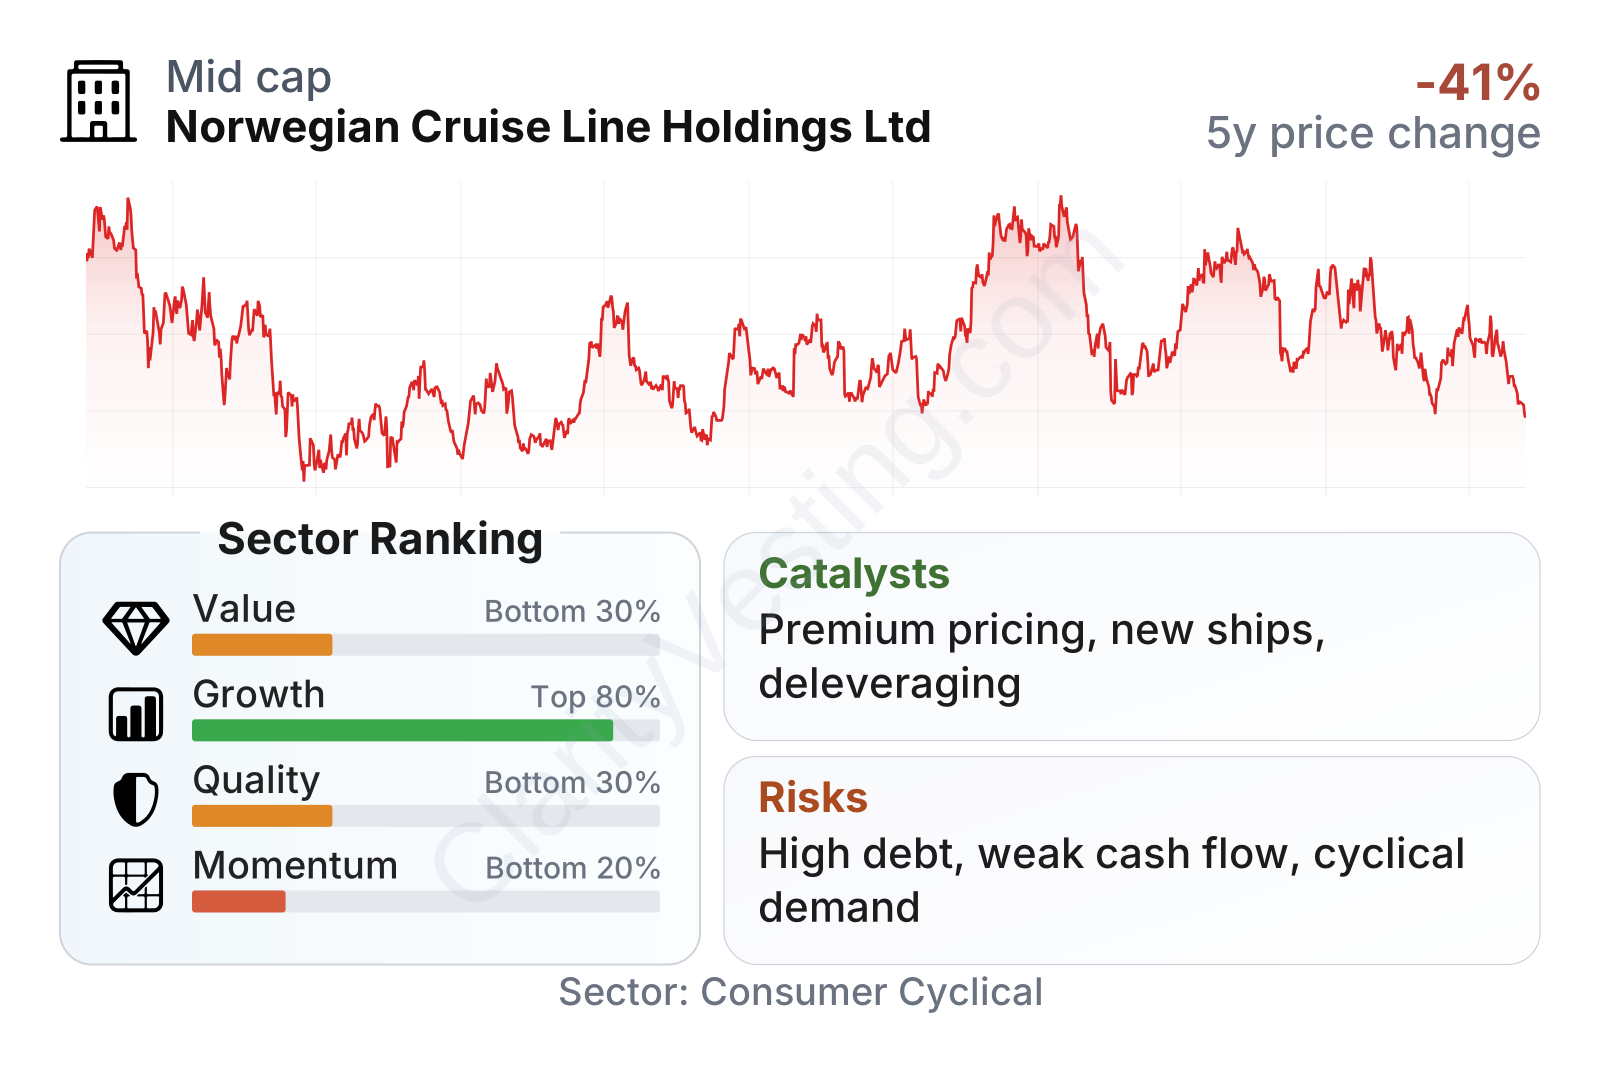
Norwegian Cruise Line Holdings is a mid-sized public company with a stock that has been notably volatile, reflected in a beta close to 1.9. The metrics table points to a mixed profile. Growth ranks relatively well within the sector, supported by a powerful multi-year recovery in revenue per share and a major improvement in operating margins. However, quality and momentum rank weaker. Leverage is far above the sector median, free cash flow is negative, and recent share-price performance has trailed much of the broader consumer cyclical group. On valuation, the earnings multiple sits below the sector median, but that lower multiple comes with balance-sheet and cash-flow concerns that the market is clearly discounting.
Growth
The cruise industry is part of the broader leisure travel market, which has benefited from the post-pandemic return of vacation demand and continued consumer interest in experiences over goods. Cruise lines also still have room to grow penetration because cruising represents only a small share of the overall vacation market. That gives the sector a structural expansion angle beyond the rebound phase, especially when operators can attract first-time cruisers, fill ships efficiently, and raise onboard spending.
For Norwegian Cruise Line Holdings, the basic growth strategy makes sense. The company has been focused on increasing occupancy, improving net yields, refining its brand positioning, and adding capacity through new ships over time. Its three-brand structure helps it address several price points, from mainstream to luxury, which can broaden demand sources and support pricing discipline. Premium and luxury exposure is particularly relevant because it can strengthen onboard economics and reduce direct reliance on the most price-sensitive customer segment.
Recent revenue growth is no longer showing the huge rebound percentages seen immediately after the pandemic disruption, which is normal. The business has moved from recovery growth to more standard expansion. Year-over-year sales growth has settled into more moderate single-digit territory recently, suggesting the company is now being judged more on yield quality, cost control, and cash generation than on simple reopening momentum.
One important point is that accounting recovery and cash recovery are not moving at the same speed. Revenue and margins improved strongly, but trailing free cash flow remains negative. That does not automatically signal business weakness for a cruise operator because ship investments and timing effects can be large, yet it does mean the next leg of the investment case depends heavily on converting stronger operating performance into steadier cash generation and gradual deleveraging.
Several catalysts could matter over the next few years. Continued normalization in occupancy and onboard spending, delivery of newer ships, and better pricing in premium itineraries can all support earnings power. The company has also highlighted multi-year strategic initiatives around fleet optimization, brand positioning, and cost efficiency. A meaningful reduction in interest burden would be especially important because it could allow more of the operating improvement to flow through to net income and cash flow.
Recent company updates have generally pointed to durable booking demand, with management emphasizing customer interest across key itineraries and continued focus on margin expansion. For long-term analysis, the most significant opportunity is less about explosive unit growth and more about whether Norwegian can turn healthy demand into consistently stronger returns on capital.
Risks
This article is for informational purposes only and does not constitute financial advice. Some content is AI-generated. See Disclaimer


