Stock Analysis · Naspers Limited (NAPRF)
Overview
Naspers Limited is a South Africa-based global consumer internet and technology investment group. For long-term readers, the simplest way to understand the business is that Naspers is no longer just an operating company with one core product. It is a collection of online platforms and investments, with value heavily influenced by its large stake in Tencent through its majority-owned subsidiary Prosus, alongside wholly owned and controlled businesses in classifieds, food delivery, payments and fintech, education technology, and e-commerce.
In practice, Naspers earns value from two broad buckets: its shareholding in Tencent and the operating performance of its own portfolio companies. That mix makes the business unusual. It combines characteristics of a holding company, a technology investor, and an operator of digital platforms across multiple countries.
The clearest way to think about revenue is by operating segments rather than by one simple product line. Based on recent annual reporting and portfolio disclosures, the largest economic exposures are approximately:
- Tencent stake / China social and gaming exposure: by far the most important source of underlying asset value, although not booked as ordinary operating revenue in the same way as Naspers’ consolidated businesses.
- E-commerce operating businesses: the main consolidated revenue base, including classifieds, food delivery, payments and fintech, and education technology.
- Classifieds: one of the larger operating contributors through platforms such as OLX and related marketplace assets.
- Food delivery: meaningful scale through iFood and other delivery interests, though profitability can vary.
- Payments and fintech: an increasingly important area as digital transactions expand in emerging markets.
- Other ventures and investments: smaller but potentially high-upside positions across online commerce and adjacent technology categories.
One important nuance is that Naspers’ market value often depends less on reported revenue and more on how the market values Tencent, Prosus, and the discount between Naspers’ share price and the underlying asset value of its holdings. That is different from a standard retailer or software company.
The long-term pattern shows a business whose reported revenue base has rebounded strongly after earlier declines, with gross profit also improving. At the same time, expenses have climbed materially, which means readers should separate top-line expansion from the harder question of how much durable operating profit the portfolio can produce.
Key Figures
| Metric | Value | Sector ⓘ |
|---|---|---|
| Date | Sep 12, 2026 | |
| Context | ||
| Sector | Consumer Cyclical | |
| Industry | Internet Retail | |
| Market Cap ⓘ | $205.73B | |
| Beta ⓘ | 0.65 | |
Value (Cheapness) | ||
| P/E Ratio ⓘ | 44.93 | 17.10 |
| FCF Yield ⓘ | 1.57% | 8.53% |
| EBIT / EV ⓘ | 48.56% | 6.46% |
| PEG ⓘ | N/A | |
Growth (Business expansion) | ||
| Revenue Growth ⓘ | 19.60% | 5.75% |
| RPS Growth (5Y CAGR) ⓘ | 26.68% | 9.14% |
| EPS Growth (5Y CAGR) ⓘ | 39.82% | -18.21% |
| Margin Growth (5Y Trend) ⓘ | -55.62% | -0.23% |
| FCF Growth (5Y CAGR) ⓘ | N/A | 4.91% |
Quality (Business durability) | ||
| ROIC (Latest) ⓘ | N/A | 12.61% |
| ROIC (5Y Median) ⓘ | 32.10% | 10.72% |
| Net Debt / EBIT (Latest) ⓘ | -0.05 | 2.10 |
| Net Debt / EBIT (5Y Median) ⓘ | 0.74 | 2.32 |
| Operating Margin (Latest) ⓘ | 122.59% | 9.25% |
| Operating Margin (5Y Median) ⓘ | 167.30% | 9.64% |
| Debt to Equity (Latest) ⓘ | 77.41% | 75.78% |
| Profit Margin (Latest) ⓘ | 45.83% | 5.33% |
| Free Cash Flow (Latest) ⓘ | $3.22B | |
Momentum (Price trend) | ||
| 3Y Return ⓘ | -71.89% | +14.53% |
| 12M Return (excl. last month) ⓘ | -84.01% | +3.08% |
| 6M Return ⓘ | -7.03% | +0.55% |
| Price vs. 200-Day MA ⓘ | -17.37% | -0.54% |
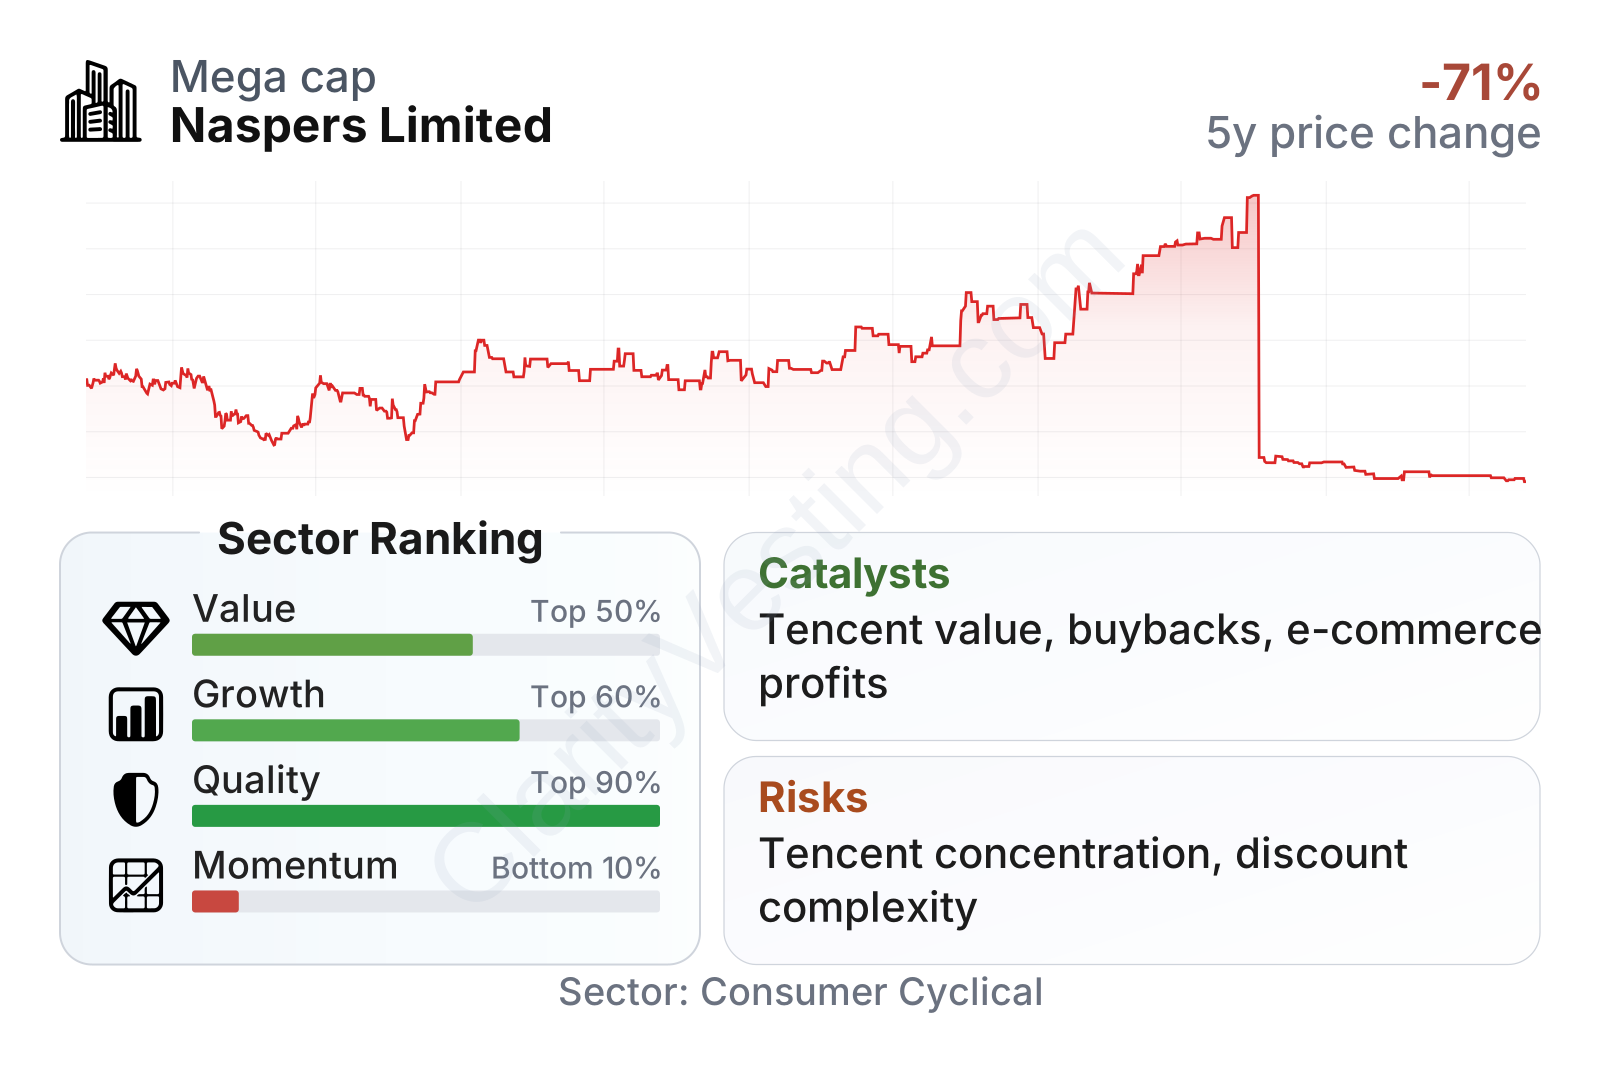
Naspers stands out for its scale, with a market capitalization above $200 billion, but the quality of that scale matters. The business ranks very strongly on balance-sheet and profitability measures relative to much of its sector, helped by low net debt pressure and unusually high reported margins. Growth indicators are respectable rather than exceptional overall, with revenue and per-share expansion ahead of many peers, but margin trends over several years have been weaker. The weakest area is market momentum: the shares have significantly underperformed over multiple time frames, which signals that the market remains unconvinced by the valuation structure or recent developments despite the company’s asset base.
Growth
Naspers is positioned in sectors that still have long runways for expansion. Online classifieds, digital payments, food delivery, e-commerce enablement, and internet platforms continue to benefit from rising smartphone use, broader internet access, and the shift of consumer spending toward digital channels. Many of Naspers’ strongest markets are in emerging economies, where online penetration can still grow for years even if short-term economic conditions are uneven.
The strategy also makes sense in a long-term framework because management has been trying to do two things at once: improve the profitability of operating businesses and narrow the gap between the market value of Naspers and the value of its assets. That second point matters a great deal. If the discount to underlying holdings narrows, shareholders can benefit even without dramatic operating growth.
The recent revenue trend appears supportive of that thesis. Growth has been running well above the median for the broader consumer cyclical universe, suggesting the portfolio still contains businesses with meaningful expansion potential. Over a five-year period, revenue per share has also risen at a solid pace, which is more useful than revenue alone because it better reflects value creation for each share outstanding.
Free cash flow remains another key positive. The company is producing billions of dollars in trailing free cash flow, which gives it flexibility to fund buybacks, support portfolio companies, reduce debt pressure, or recycle capital into higher-return opportunities. For a company built partly around investments and partly around operating businesses, that financial flexibility is an important growth enabler.
A major catalyst in recent years has been the continued execution of open-ended share repurchase programs involving both Naspers and Prosus. Management has used asset sales and balance-sheet capacity to repurchase shares when they traded at a sizable discount to net asset value. This is not conventional operating growth, but it can still improve per-share economics over time. Another important opportunity is further profitability improvement in e-commerce units that have spent years prioritizing scale. If those platforms can move from growth-at-all-costs toward steadier cash generation, the market may view the portfolio more favorably.
Risks
This article is for informational purposes only and does not constitute financial advice. Some content is AI-generated. See Disclaimer


