Stock Analysis · Monarch Casino & Resort Inc (MCRI)
Overview
Monarch Casino & Resort Inc. is a regional gaming and hospitality company that owns and operates two main properties: Atlantis Casino Resort Spa in Reno, Nevada, and Monarch Casino Resort Spa Black Hawk in Black Hawk, Colorado. Its business combines casino gaming with hotel rooms, food and beverage, and other resort amenities such as spas and entertainment. In simple terms, Monarch makes money when visitors gamble, stay at its hotels, dine on-site, and use resort services.
The company’s revenue is mostly generated by casino activity, while the hotel and food businesses support traffic, length of stay, and customer loyalty. Based on company filings, the revenue mix is approximately:
- Casino revenue: about 77% to 81% — slot machines, table games, poker, sports betting where applicable, and related gaming activity.
- Food and beverage: about 9% to 11% — restaurants, bars, banquets, and on-property dining.
- Hotel revenue: about 8% to 10% — room nights, resort stays, and related lodging services.
- Other revenue: about 1% to 3% — spa, retail, entertainment, and miscellaneous resort services.
That mix matters because it shows Monarch is primarily a gaming business, but one supported by a full-resort model. The Reno and Black Hawk properties target drive-in regional customers rather than destination tourism on the scale of Las Vegas. This can make demand more stable than convention-heavy markets, though it also leaves the company more concentrated in just two assets.
The business has also become more productive over time. Revenue has climbed from roughly $395 million in 2021 to about $545 million in 2025, while net income and operating income have generally improved as the newer Black Hawk expansion matured. Interest expense has fallen sharply over the same period, reflecting a much lighter debt burden.
The broad picture is favorable: a larger share of revenue is now converting into operating profit and net income than in the earlier post-pandemic years, helped by stronger property economics and very low financing costs.
Key Figures
| Metric | Value | Sector ⓘ |
|---|---|---|
| Date | Sep 12, 2026 | |
| Context | ||
| Sector | Consumer Cyclical | |
| Industry | Resorts & Casinos | |
| Market Cap ⓘ | $2.18B | |
| Beta ⓘ | 1.34 | |
Value (Cheapness) | ||
| P/E Ratio ⓘ | 19.23 | 17.10 |
| FCF Yield ⓘ | 7.06% | 8.53% |
| EBIT / EV ⓘ | 6.27% | 6.46% |
| PEG ⓘ | 1.07 | |
Growth (Business expansion) | ||
| Revenue Growth ⓘ | 4.20% | 5.75% |
| RPS Growth (5Y CAGR) ⓘ | 9.35% | 9.14% |
| EPS Growth (5Y CAGR) ⓘ | -9.26% | -18.21% |
| Margin Growth (5Y Trend) ⓘ | 1.37% | -0.23% |
| FCF Growth (5Y CAGR) ⓘ | 12.15% | 4.91% |
Quality (Business durability) | ||
| ROIC (Latest) ⓘ | 19.53% | 12.61% |
| ROIC (5Y Median) ⓘ | 15.73% | 10.72% |
| Net Debt / EBIT (Latest) ⓘ | -0.99 | 2.10 |
| Net Debt / EBIT (5Y Median) ⓘ | -0.21 | 2.32 |
| Operating Margin (Latest) ⓘ | 22.55% | 9.25% |
| Operating Margin (5Y Median) ⓘ | 22.73% | 9.64% |
| Debt to Equity (Latest) ⓘ | 2.22% | 75.78% |
| Profit Margin (Latest) ⓘ | 20.40% | 5.33% |
| Free Cash Flow (Latest) ⓘ | $154.30M | |
Momentum (Price trend) | ||
| 3Y Return ⓘ | +94.55% | +14.53% |
| 12M Return (excl. last month) ⓘ | +26.53% | +3.08% |
| 6M Return ⓘ | +22.92% | +0.55% |
| Price vs. 200-Day MA ⓘ | +12.15% | -0.54% |
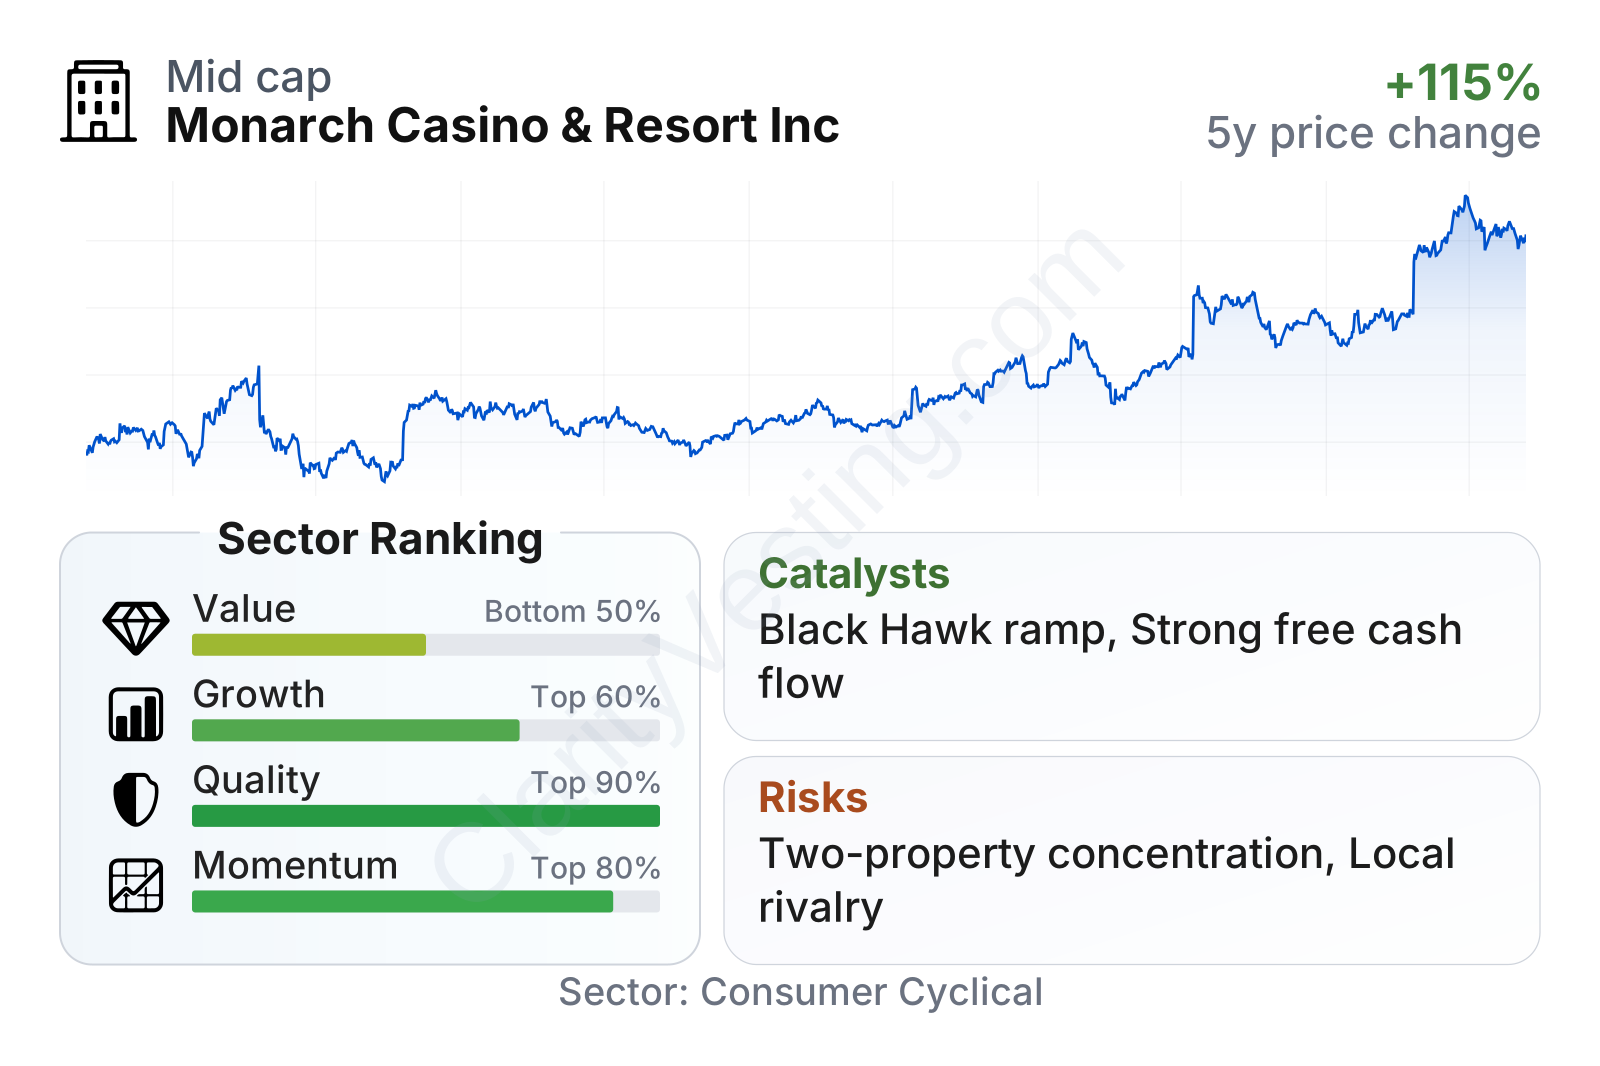
Monarch stands out most clearly on business quality. Profitability is well above the sector median, returns on invested capital are strong, and leverage is unusually low for a casino operator. Growth is positive rather than explosive, and the value profile looks more middle-of-the-pack, which fits a company that has earned a premium for balance-sheet strength and steady execution. Share price performance has also been notably stronger than much of the broader consumer cyclical group.
Growth
The regional casino industry is not a hyper-growth sector, but it can still be attractive when an operator has a well-located property, disciplined capital spending, and a focused customer base. Monarch fits that pattern. Demand for regional gaming has remained supported by convenience-driven travel, local entertainment spending, and a customer mix that does not depend entirely on fly-in tourism.
Its strategy for growth has been straightforward: invest heavily in a small number of high-quality assets, then improve occupancy, gaming volumes, pricing, and margins over time. The Black Hawk resort expansion has been the clearest example. That project increased Monarch’s ability to capture more overnight guests and higher-value gaming customers, and it gave the company a more competitive property in one of Colorado’s key gaming markets.
Revenue growth has slowed from the initial post-pandemic rebound to a more normal pace, recently running in the low-single-digit to high-single-digit range. That is not unusual for a mature regional casino operator. What is more important is that the company has maintained positive growth while preserving strong margins, showing that recent gains have not relied only on aggressive discounting or excessive expansion.
Cash generation has improved meaningfully over the last several years. Free cash flow moved from under $100 million in earlier periods to roughly $150 million more recently, which gives Monarch flexibility for property upgrades, shareholder returns, or future development without depending heavily on lenders. For a company of this size, that is an important growth support because it reduces the need to stretch the balance sheet to pursue opportunities.
A practical catalyst is the company’s ability to keep refining the earnings power of Black Hawk while sustaining Atlantis in Reno as a durable cash-producing asset. If visitation, hotel rates, and gaming spend continue to improve gradually, even modest revenue growth can translate into solid profit expansion because the fixed-cost base is already largely in place.
Recent company updates have also pointed to continued strength in operating performance rather than a one-time rebound. The most relevant opportunity is not a dramatic new business line, but the possibility of further optimization at its existing properties, especially in premium gaming, hotel utilization, and customer mix.
Risks
This article is for informational purposes only and does not constitute financial advice. Some content is AI-generated. See Disclaimer


