Stock Analysis · Man Wah Holdings Limited (MAWHF)
Overview
Man Wah Holdings Limited is a furniture manufacturer and retailer best known for upholstered sofas, recliners, and related home seating products. The company is headquartered in Hong Kong and has built its business around large-scale manufacturing, product design, brand development, and distribution across China and overseas markets. Its best-known brand is Cheers, and its products are sold through a mix of self-operated stores, distributors, and export channels.
The business is mainly tied to household furniture demand, especially living-room seating. That makes Man Wah part of the broader consumer discretionary sector: when housing activity, renovation, and consumer confidence are healthy, demand can improve; when the cycle weakens, furniture purchases are often delayed.
Based on company reporting structure in recent annual disclosures, revenue is primarily generated from the sale of sofas and supporting home furnishing products, with China and North America standing out as key end markets. A simple way to think about the revenue mix is:
- Sofas and recliners: by far the largest contributor, likely the clear majority of total revenue.
- Other furniture and home products: mattresses, panels, and related furnishing categories, a smaller but still meaningful share.
- Home-use and ancillary products: smaller contributions from complementary household items and other business lines.
- Geographic mix: China remains a major market, while overseas sales, especially to North America, are also important.
Over the last several years, the company has remained profitable even as revenue moved down from earlier peaks. The broad pattern suggests a business with good manufacturing efficiency and brand reach, but one still exposed to cyclical pressure in property-related consumption and export demand.
The operating picture shows a company that still converts a solid portion of sales into operating profit. Revenue has trended lower from the 2022 high, but cost control has helped preserve profitability better than many consumer discretionary businesses manage during softer periods.
Key Figures
| Metric | Value | Sector ⓘ |
|---|---|---|
| Date | Sep 12, 2026 | |
| Context | ||
| Sector | Consumer Cyclical | |
| Industry | Furnishings, Fixtures & Appliances | |
| Market Cap ⓘ | $2.11B | |
| Beta ⓘ | 1.39 | |
Value (Cheapness) | ||
| P/E Ratio ⓘ | 9.17 | 17.10 |
| FCF Yield ⓘ | 116.66% | 8.53% |
| EBIT / EV ⓘ | N/A | 6.46% |
| PEG ⓘ | N/A | |
Growth (Business expansion) | ||
| Revenue Growth ⓘ | -2.50% | 5.75% |
| RPS Growth (5Y CAGR) ⓘ | -6.04% | 9.14% |
| EPS Growth (5Y CAGR) ⓘ | -29.18% | -18.21% |
| Margin Growth (5Y Trend) ⓘ | 0.30% | -0.23% |
| FCF Growth (5Y CAGR) ⓘ | 30.45% | 4.91% |
Quality (Business durability) | ||
| ROIC (Latest) ⓘ | N/A | 12.61% |
| ROIC (5Y Median) ⓘ | 13.72% | 10.72% |
| Net Debt / EBIT (Latest) ⓘ | 0.34 | 2.10 |
| Net Debt / EBIT (5Y Median) ⓘ | 0.36 | 2.32 |
| Operating Margin (Latest) ⓘ | 15.38% | 9.25% |
| Operating Margin (5Y Median) ⓘ | 14.52% | 9.64% |
| Debt to Equity (Latest) ⓘ | 34.13% | 75.78% |
| Profit Margin (Latest) ⓘ | 11.03% | 5.33% |
| Free Cash Flow (Latest) ⓘ | $2.47B | |
Momentum (Price trend) | ||
| 3Y Return ⓘ | -5.07% | +14.53% |
| 12M Return (excl. last month) ⓘ | +16.62% | +3.08% |
| 6M Return ⓘ | -8.32% | +0.55% |
| Price vs. 200-Day MA ⓘ | -19.30% | -0.54% |
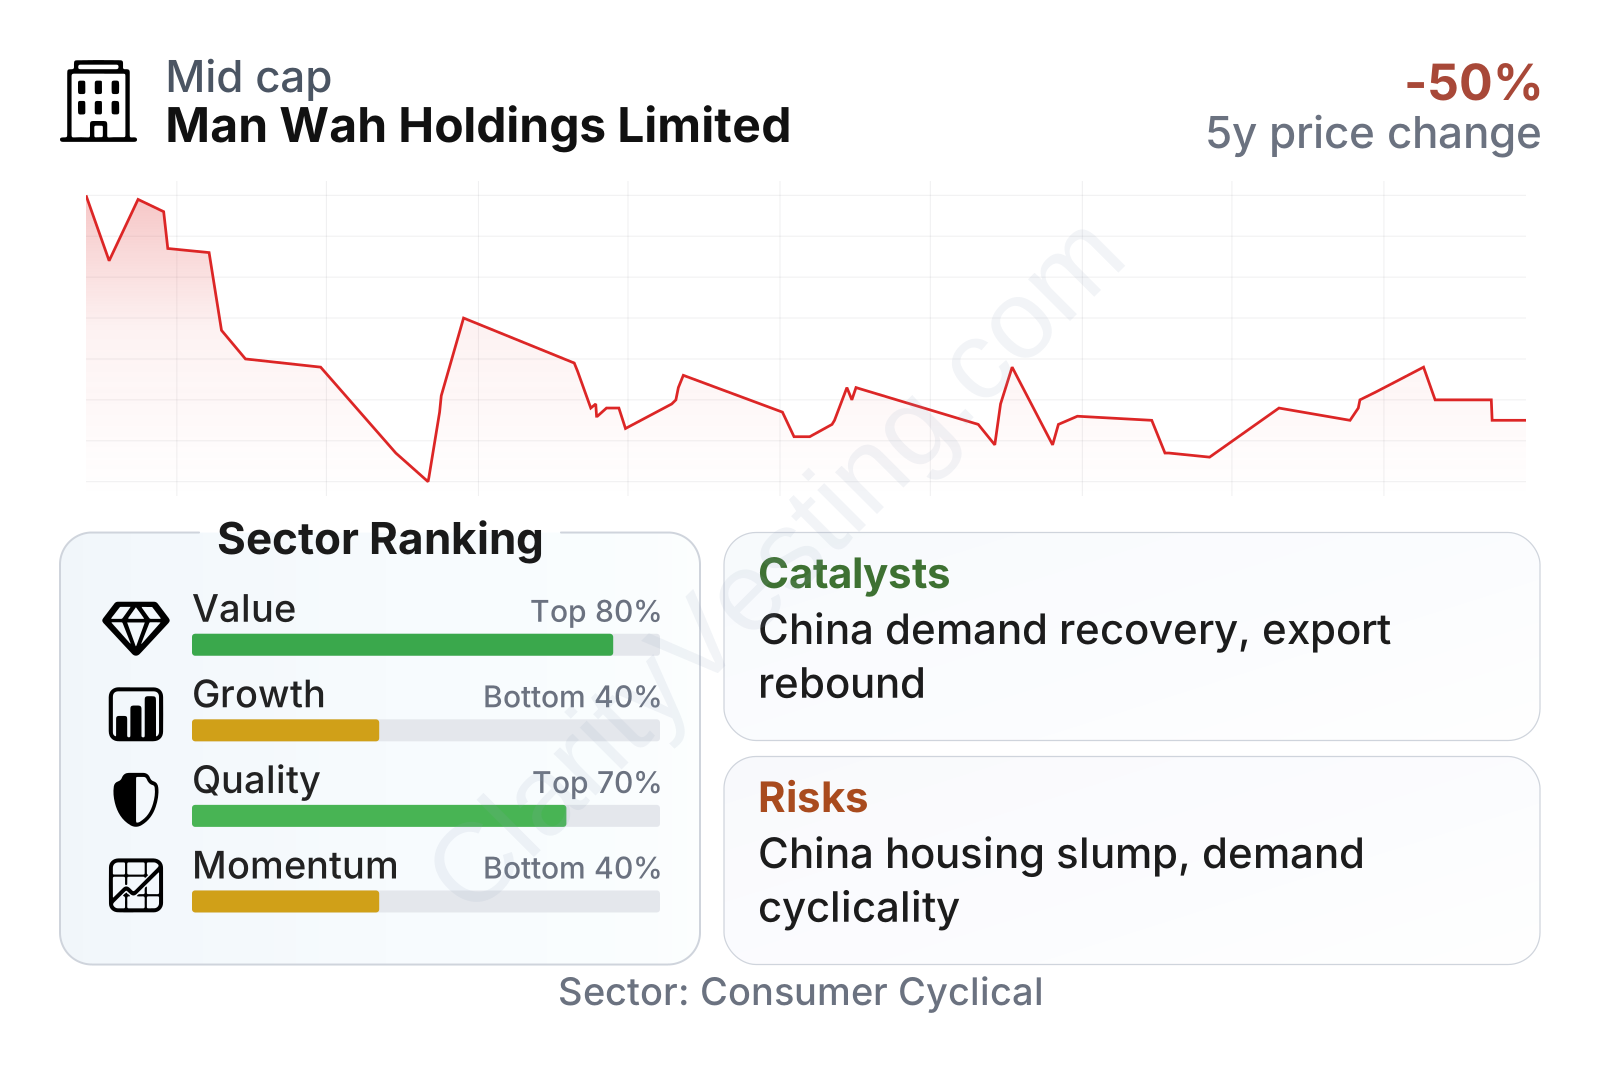
Man Wah currently sits in an interesting position: the market value is in the low billions, which makes it a meaningful listed furniture player but not a giant on a global scale. On valuation measures, it screens cheaper than much of its sector, while on quality measures it appears stronger than average. Profitability and balance sheet strength stand out more than growth and share-price momentum.
The table points to a company with above-sector operating margins, profit margins, and leverage discipline. Net debt relative to earnings is very low, which gives the business more resilience if demand remains uneven. At the same time, growth indicators are weaker than the sector median, reflecting recent revenue pressure and a slower multi-year top-line trend.
Growth
Furniture is not a fast-growth industry in the same way as software or semiconductors, but it can still produce durable long-term winners when companies combine scale, brand recognition, efficient sourcing, and strong distribution. Man Wah operates in a segment where product comfort, design, delivery reliability, and dealer relationships matter. That creates room for steady expansion, especially if a company can take share even when the end market is only growing modestly.
Its strategy appears sensible for that kind of environment. The company has long emphasized large-scale manufacturing, integrated supply capabilities, branded retail presence in China, and export relationships abroad. This setup can support growth in several ways: wider store penetration in lower-tier Chinese cities, product mix improvement, overseas expansion, and margin protection through manufacturing efficiency.
Near-term growth has clearly been soft. Recent year-over-year revenue performance is below the sector median, and the broader multi-year sales trend has been negative. That said, this does not look like a business losing all economic value. Margins have held up relatively well, suggesting that weaker demand has not fully undermined pricing discipline or cost structure.
Cash generation is one of the more constructive points in the profile. Free cash flow has been strong relative to the company’s size, and the longer-term trend in cash generation is much better than the headline revenue trend. For a furniture manufacturer, that matters because cash can fund dividends, store network support, efficiency upgrades, and balance sheet flexibility without relying heavily on debt.
As for catalysts, the most important ones are operational rather than speculative. A stabilization in China home furnishing demand, better U.S. and export orders, and further gains from cost control could all improve the earnings picture. The company’s low leverage also means it has room to navigate a recovery more comfortably than more indebted competitors. Recent annual reporting for fiscal 2026 still shows profitability, which keeps the possibility of earnings normalization alive if demand conditions improve.
Risks
This article is for informational purposes only and does not constitute financial advice. Some content is AI-generated. See Disclaimer


