Stock Analysis · Manhattan Associates Inc (MANH)
Overview
Manhattan Associates is a supply chain and commerce software company. In simple terms, it builds the systems that help retailers, wholesalers, manufacturers, and logistics providers manage inventory, warehouses, transportation, orders, and omnichannel fulfillment. Its software is used to answer practical questions such as: where is inventory located, which warehouse should ship an order, how can a company reduce delivery costs, and how can stores and online channels work together more efficiently.
The business has increasingly shifted toward cloud-based subscriptions, which matters because recurring software revenue is usually more predictable than one-time license sales. Manhattan Associates also generates revenue from professional services tied to implementation, configuration, training, and ongoing customer support.
Based on recent company filings, the main revenue sources are approximately:
- Services: about 43% to 47% of revenue. This includes professional services, implementation work, training, and customer support.
- Cloud subscriptions: about 38% to 42% of revenue. This is recurring revenue from cloud-native offerings such as warehouse management, transportation management, order management, and broader supply chain applications.
- License revenue: about 10% to 15% of revenue. This comes from traditional on-premises software licenses and has become less important as the company moves customers toward cloud products.
That mix shows a business in transition from legacy software sales toward a more recurring and scalable model. Over the last several years, revenue has risen from about $664 million in 2021 to just over $1.08 billion in 2025, while gross profit and operating income also expanded. Research and development remains a meaningful expense, which is typical for software companies that need to keep improving their products.
The revenue flow highlights two important points: first, the company has maintained strong gross profitability as sales increased; second, operating income has grown faster than many operating costs, which suggests better scale as more customers adopt its software.
Key Figures
| Metric | Value | Sector ⓘ |
|---|---|---|
| Date | Sep 12, 2026 | |
| Context | ||
| Sector | Technology | |
| Industry | Software - Application | |
| Market Cap ⓘ | $11.77B | |
| Beta ⓘ | 0.95 | |
Value (Cheapness) | ||
| P/E Ratio ⓘ | 58.84 | 29.51 |
| FCF Yield ⓘ | 3.39% | 4.25% |
| EBIT / EV ⓘ | 2.40% | 2.85% |
| PEG ⓘ | 2.57 | |
Growth (Business expansion) | ||
| Revenue Growth ⓘ | 9.30% | 15.40% |
| RPS Growth (5Y CAGR) ⓘ | 14.47% | 8.56% |
| EPS Growth (5Y CAGR) ⓘ | -6.28% | -11.88% |
| Margin Growth (5Y Trend) ⓘ | 6.24% | 0.46% |
| FCF Growth (5Y CAGR) ⓘ | 19.87% | 9.80% |
Quality (Business durability) | ||
| ROIC (Latest) ⓘ | 85.23% | 9.44% |
| ROIC (5Y Median) ⓘ | 69.92% | 8.30% |
| Net Debt / EBIT (Latest) ⓘ | -0.47 | 0.54 |
| Net Debt / EBIT (5Y Median) ⓘ | -1.18 | 0.44 |
| Operating Margin (Latest) ⓘ | 25.16% | 9.58% |
| Operating Margin (5Y Median) ⓘ | 23.01% | 8.25% |
| Debt to Equity (Latest) ⓘ | 34.21% | 33.33% |
| Profit Margin (Latest) ⓘ | 18.67% | 7.14% |
| Free Cash Flow (Latest) ⓘ | $399.19M | |
Momentum (Price trend) | ||
| 3Y Return ⓘ | +1.35% | +45.48% |
| 12M Return (excl. last month) ⓘ | -9.46% | +23.48% |
| 6M Return ⓘ | +43.86% | +20.93% |
| Price vs. 200-Day MA ⓘ | +27.05% | +7.43% |
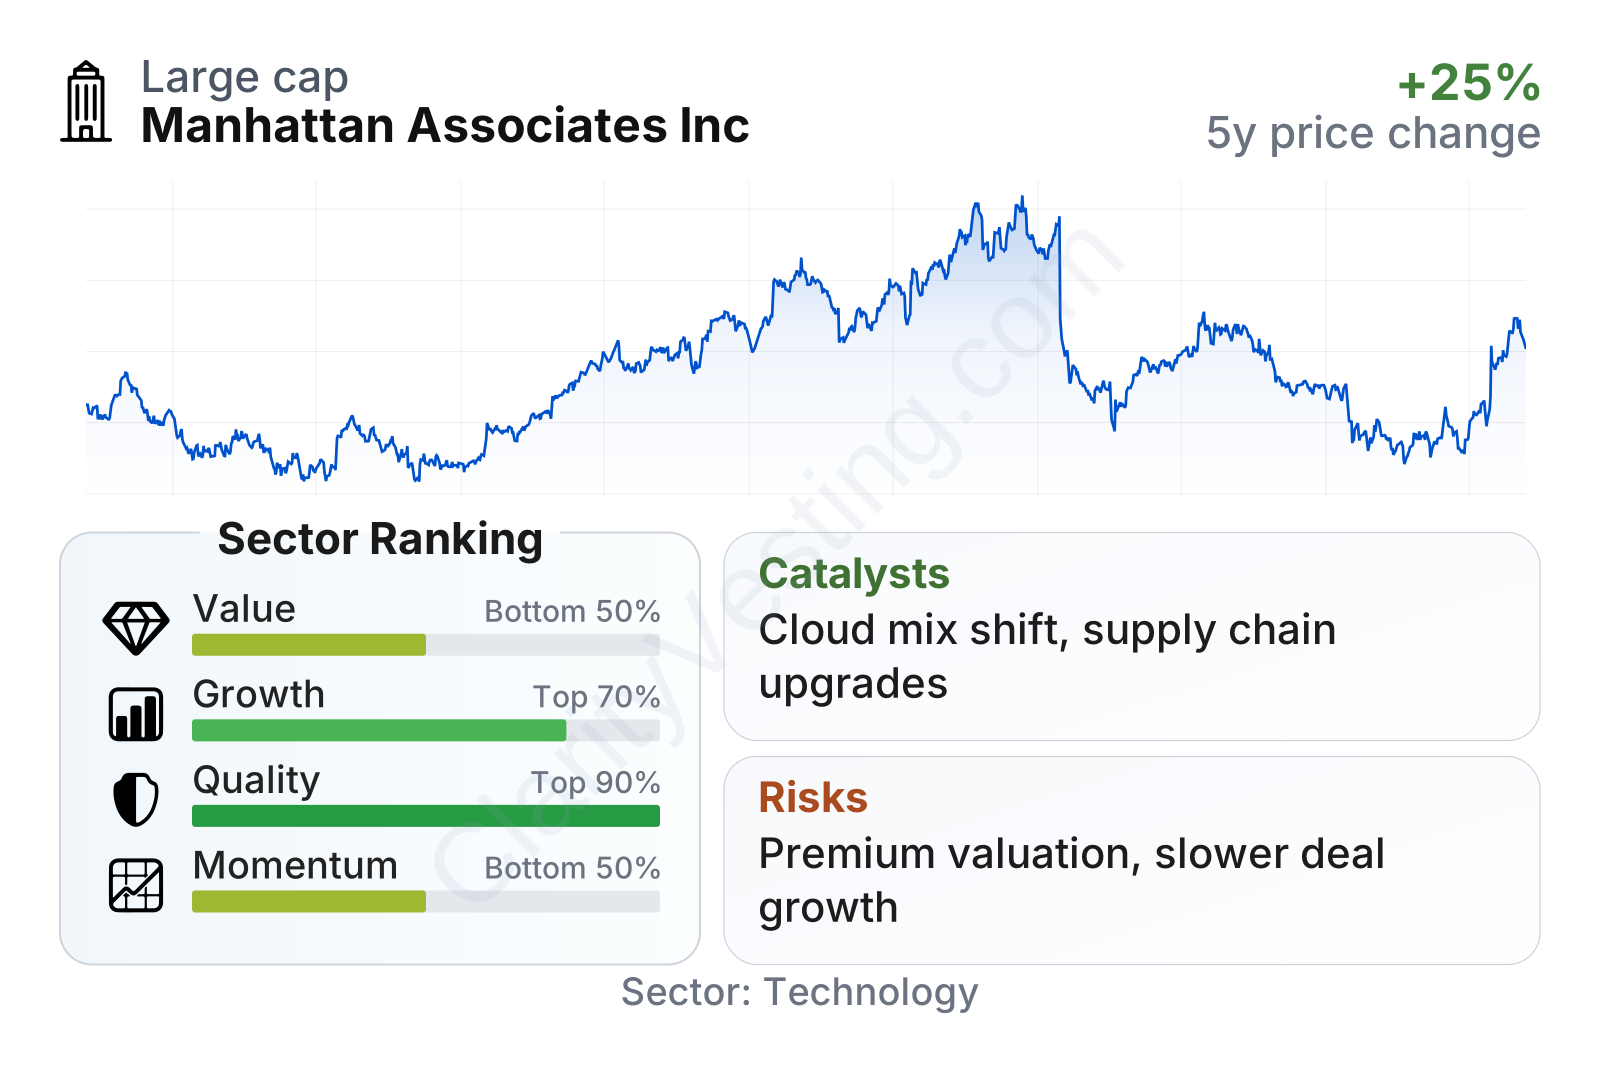
Manhattan Associates stands out most on business quality rather than on cheapness. Profitability is far above the software sector median, with operating margin around 25% and profit margin near 19%. Return on invested capital is exceptionally high, and the balance sheet remains conservative overall, even though leverage is somewhat higher than its own earlier levels. Growth is still positive, but recent year-over-year revenue expansion is slower than the sector median. Share price momentum has been mixed over the last few years, with weakness over longer periods but a stronger rebound in the most recent months.
Growth
Manhattan Associates operates in a market with durable long-term demand. Companies across retail, manufacturing, wholesale, and logistics are still modernizing supply chains after years of disruption, rising labor costs, higher customer expectations, and more complex fulfillment networks. Warehouse automation, real-time inventory visibility, and omnichannel order management remain important spending areas, especially for larger enterprises.
The company’s strategy appears coherent for that environment. Its cloud platform brings together warehouse management, transportation management, order management, and supply chain planning. That broad product set can make Manhattan Associates more valuable to customers that want fewer disconnected systems. It also creates cross-selling potential: a customer that starts with warehouse software may later add transportation, planning, or order management tools.
Revenue growth has cooled from the very strong levels seen in 2023, when year-over-year expansion moved above 20%, but growth has not disappeared. The recent pattern shows a slowdown into low single-digit rates during 2025 followed by a reacceleration toward about 9% by mid-2026. That is not rapid growth by software-sector standards, but it suggests demand remains intact and the business has not stalled.
Cash generation is a major positive. Free cash flow has climbed steadily from roughly $170 million in early 2022 to nearly $400 million on a trailing basis. For a long-term view, that matters because it gives the company room to invest in product development, support cloud expansion, and absorb periods of slower sales without relying heavily on external financing.
Recent company communications have continued to emphasize cloud momentum and product innovation around unified supply chain execution. A notable opportunity comes from large enterprises replacing older, fragmented systems with modern platforms that can manage both store and e-commerce fulfillment. As more companies seek a single view of inventory and orders, Manhattan Associates is positioned in a category that remains strategically important rather than discretionary.
Risks
This article is for informational purposes only and does not constitute financial advice. Some content is AI-generated. See Disclaimer


