Stock Analysis · Macys Inc (M)
Overview
Macy’s, Inc. is a large U.S. retail company best known for the Macy’s department store chain, but its business also includes Bloomingdale’s and Bluemercury. It sells apparel, shoes, beauty products, accessories, home goods, and gifts through stores, websites, and mobile apps. In simple terms, Macy’s operates as a multi-brand retailer aimed at different customer segments: Macy’s serves the broad middle market, Bloomingdale’s targets a more upscale shopper, and Bluemercury focuses on beauty and skincare.
The company’s revenue is still overwhelmingly tied to retail merchandise sales, with stores remaining important even as digital sales play a major role in reaching customers. Based on recent annual disclosures, Macy’s revenue mix can be described approximately as follows:
- Macy’s brand: about 85% to 88% of total revenue. This includes sales from Macy’s stores and macys.com across fashion, beauty, and home categories.
- Bloomingdale’s: about 8% to 10% of total revenue. This includes Bloomingdale’s stores, bloomingdales.com, and luxury-oriented merchandise.
- Bluemercury: about 2% to 3% of total revenue. This business focuses on prestige beauty, skincare, cosmetics, and spa-related offerings.
- Other revenue: a small share, generally below 3%, including credit card partnership income and other ancillary items that are reported separately from merchandise sales when applicable.
Macy’s is not a diversified global luxury group or a fast-growing digital marketplace. It is primarily a U.S. department store operator trying to stabilize sales, improve profitability, and shift toward stronger categories such as beauty, luxury-leaning formats, and better-performing locations. One useful point for long-term readers is that the business remains large and well known, but it is also in the middle of a difficult reinvention rather than a simple expansion phase.
The broader operating picture shows a company with lower revenue than a few years ago, but one that has rebuilt profitability from the 2024 low point. Sales have drifted down from the post-pandemic peak, while operating costs and merchandise margins have become more important than top-line growth in explaining recent results.
The flow from sales to profit highlights that Macy’s still produces meaningful gross profit, but also carries a large fixed cost base in store operations, staffing, and overhead. Compared with the 2022 peak, revenue and gross profit have moved lower, which means the turnaround depends heavily on expense discipline and better merchandise execution rather than on rapid expansion.
Key Figures
| Metric | Value | Sector ⓘ |
|---|---|---|
| Date | Sep 14, 2026 | |
| Context | ||
| Sector | Consumer Cyclical | |
| Industry | Department Stores | |
| Market Cap ⓘ | $5.77B | |
| Beta ⓘ | 1.43 | |
Value (Cheapness) | ||
| P/E Ratio ⓘ | 8.09 | 17.10 |
| FCF Yield ⓘ | 25.85% | 8.53% |
| EBIT / EV ⓘ | 12.16% | 6.46% |
| PEG ⓘ | 2.89 | |
Growth (Business expansion) | ||
| Revenue Growth ⓘ | 1.20% | 5.75% |
| RPS Growth (5Y CAGR) ⓘ | 0.28% | 9.14% |
| EPS Growth (5Y CAGR) ⓘ | -45.69% | -18.19% |
| Margin Growth (5Y Trend) ⓘ | -4.18% | -0.23% |
| FCF Growth (5Y CAGR) ⓘ | -15.92% | 4.91% |
Quality (Business durability) | ||
| ROIC (Latest) ⓘ | 17.60% | 12.61% |
| ROIC (5Y Median) ⓘ | 9.78% | 10.72% |
| Net Debt / EBIT (Latest) ⓘ | 3.26 | 2.11 |
| Net Debt / EBIT (5Y Median) ⓘ | 4.18 | 2.32 |
| Operating Margin (Latest) ⓘ | 5.11% | 9.25% |
| Operating Margin (5Y Median) ⓘ | 4.18% | 9.64% |
| Debt to Equity (Latest) ⓘ | 32.36% | 75.99% |
| Profit Margin (Latest) ⓘ | 3.29% | 5.34% |
| Free Cash Flow (Latest) ⓘ | $1.49B | |
Momentum (Price trend) | ||
| 3Y Return ⓘ | +117.38% | +14.39% |
| 12M Return (excl. last month) ⓘ | +93.96% | +3.08% |
| 6M Return ⓘ | +31.04% | +0.55% |
| Price vs. 200-Day MA ⓘ | +3.22% | -0.54% |
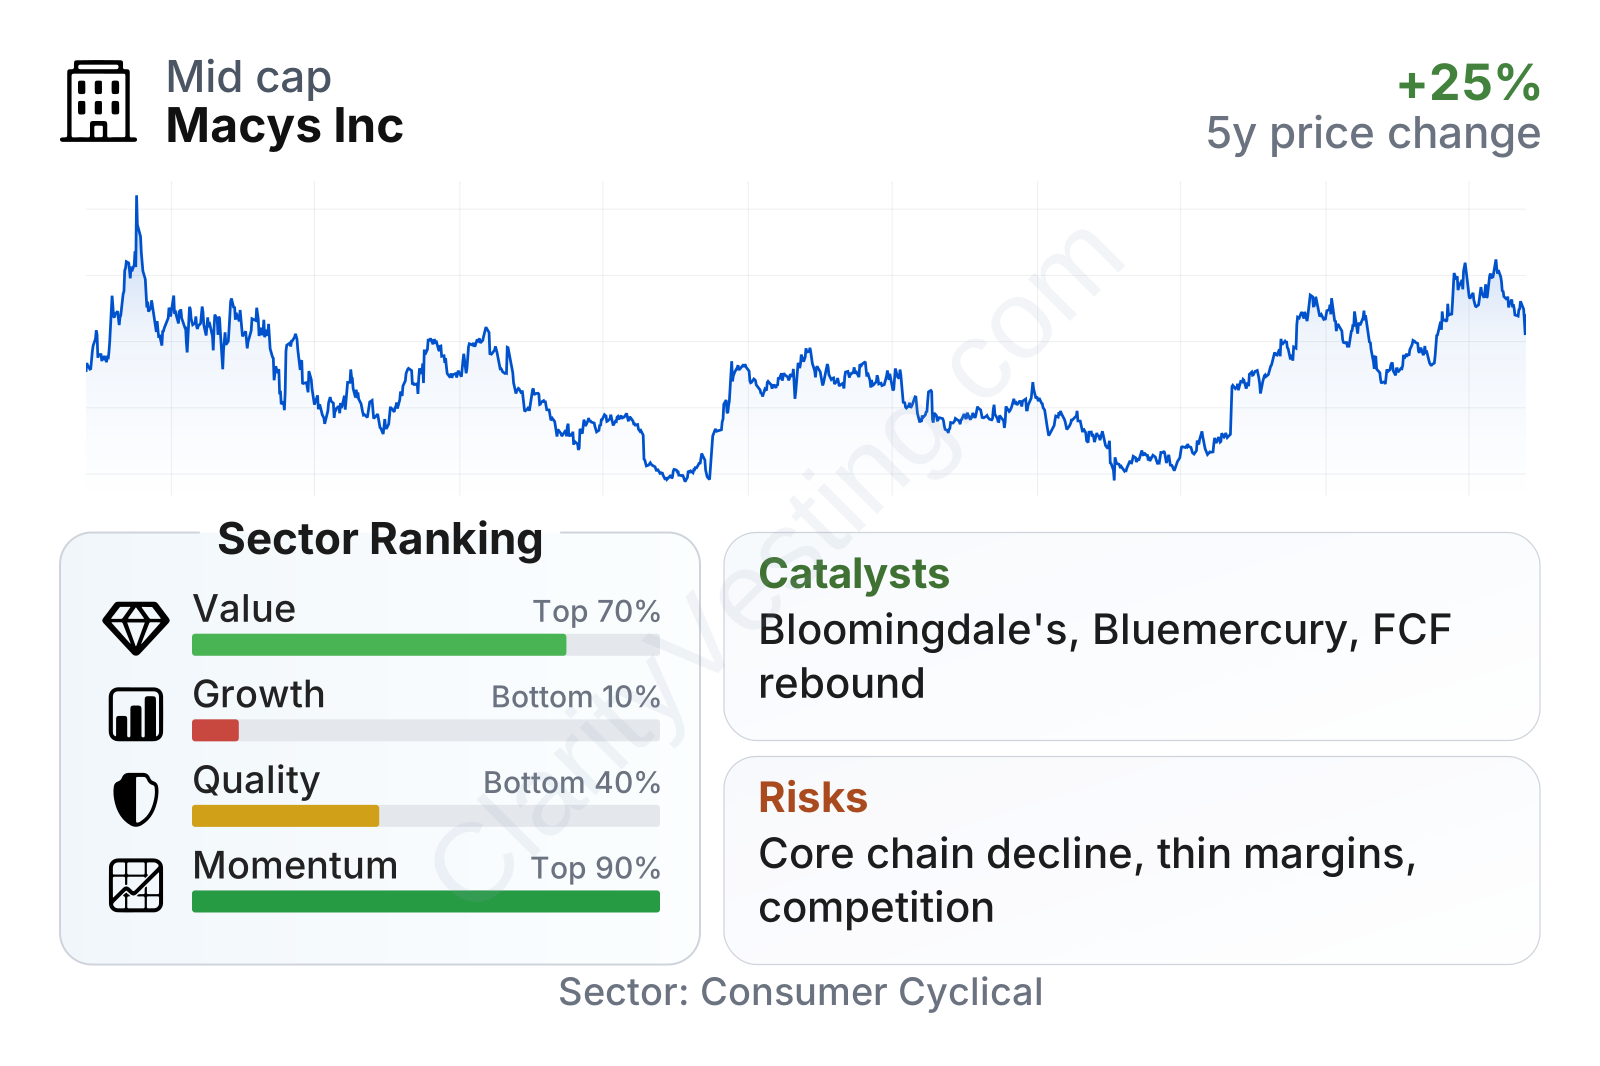
Macy’s currently looks inexpensive on common valuation measures relative to much of the consumer discretionary sector, and its cash generation is stronger than the sector median. At the same time, the table also points to the central tension in the stock: value and recent market momentum look favorable, while growth ranks very weakly and operating quality is mixed. Return on invested capital is respectable, but margins and leverage-related measures remain less comfortable than the best retailers in the sector.
The share price history also shows that this is not a steady compounding stock. It has gone through sharp swings over the last several years, reflecting changing expectations around consumer spending, profitability, real estate value, and turnaround progress. That makes the underlying business performance more important than short-term price moves when assessing the long-term case.
Growth
The company operates in a mature sector, not a structurally high-growth one. Department stores in the U.S. have been under pressure for years from off-price chains, e-commerce specialists, big-box retailers, and brand-owned websites. That means Macy’s is not benefiting from a rising industry tide. Its growth depends much more on taking share in specific categories, improving execution, and using its store base more efficiently.
Macy’s current strategy is more realistic than aggressive. Management has focused on closing weaker locations, investing in stronger stores, expanding smaller-format concepts in selected markets, and leaning into categories that have shown better resilience such as beauty and luxury-adjacent retail through Bloomingdale’s and Bluemercury. That approach makes strategic sense because it concentrates capital where customer traffic and profitability are better, rather than defending every legacy store equally.
Digital capability also remains an important part of the growth argument. Macy’s has long had a national online presence, and its ability to combine stores with online fulfillment, pickup, and returns gives it some practical advantages over smaller traditional retailers. This does not make Macy’s a digital winner on the level of the largest online platforms, but it does help preserve relevance with customers who shop across channels.
Revenue trends show why the market remains cautious. After strong post-pandemic comparisons, Macy’s moved through a long stretch of negative year-over-year sales. More recently, growth has turned slightly positive again, but only at a low level, around the low-single-digit percentage range. In other words, the business appears closer to stabilization than to a true growth cycle, and that distinction matters for long-term expectations.
Cash generation has improved much more clearly than revenue growth. Free cash flow rebounded strongly from the weak 2023-2024 period and recently moved back above the $1 billion mark on a trailing basis. That is an important support factor because it gives the company more flexibility to manage debt, invest in stores and technology, and absorb difficult retail periods without relying entirely on sales growth.
A notable catalyst in the recent period has been the company’s “Bold New Chapter” strategy and related portfolio actions, including store rationalization and investment in stronger banners and locations. Macy’s has also continued to highlight momentum in Bloomingdale’s and Bluemercury, two businesses that fit better with categories where consumers are often more resilient. If those banners keep outgrowing the core Macy’s chain, they can gradually improve the company’s mix even if total company growth remains modest.
Risks
This article is for informational purposes only and does not constitute financial advice. Some content is AI-generated. See Disclaimer


