Stock Analysis · Las Vegas Sands Corp (LVS)
Overview
Las Vegas Sands is a large resort and casino company focused on destination properties in Asia. After selling its Las Vegas operating assets several years ago, the business is now centered on integrated resorts in Macao and Singapore. These properties combine casinos, hotels, convention space, shopping malls, restaurants, entertainment, and other visitor services. In simple terms, the company makes money by attracting tourists, gamblers, business travelers, and luxury shoppers to a small number of very large resort complexes.
The business is concentrated in two markets. Macao is the larger piece by revenue because Las Vegas Sands operates several properties there through Sands China, including The Venetian Macao, The Londoner Macao, The Parisian Macao, Plaza Macao, and Sands Macao. Singapore is smaller by property count but highly important because Marina Bay Sands is one of the most profitable resorts in the world.
Based on the latest annual mix disclosed by the company, revenue mainly comes from:
- Casino and gaming revenue: approximately 76% of total revenue. This includes mass-market table games, slot machines, and VIP-related gaming activity where permitted.
- Rooms: approximately 9%. This is hotel revenue from tourists, premium guests, and business travelers.
- Mall and retail rentals: approximately 7%. This comes from leasing premium retail space to luxury brands and other tenants inside its resorts.
- Food and beverage: approximately 4%. This includes restaurants, bars, banquets, and catering.
- Convention, ferry, entertainment, and other: approximately 4%. This includes meetings, exhibitions, transportation-related activity, and other non-gaming services.
This mix matters because it shows that Las Vegas Sands is still primarily a gaming business, even though management often highlights its broader resort model. The non-gaming pieces are meaningful because they help fill hotel rooms, support premium pricing, and make the properties more resilient than a stand-alone casino.
The broader financial flow shows a sharp recovery since the pandemic period: revenue and operating income have rebounded strongly, while interest expense remains a notable ongoing cost because this is still a debt-heavy company.
Key Figures
| Metric | Value | Sector ⓘ |
|---|---|---|
| Date | Sep 12, 2026 | |
| Context | ||
| Sector | Consumer Cyclical | |
| Industry | Resorts & Casinos | |
| Market Cap ⓘ | $27.74B | |
| Beta ⓘ | 0.82 | |
Value (Cheapness) | ||
| P/E Ratio ⓘ | 16.60 | 17.10 |
| FCF Yield ⓘ | 10.05% | 8.53% |
| EBIT / EV ⓘ | 7.84% | 6.46% |
| PEG ⓘ | 0.90 | |
Growth (Business expansion) | ||
| Revenue Growth ⓘ | -0.70% | 5.75% |
| RPS Growth (5Y CAGR) ⓘ | 35.68% | 9.14% |
| EPS Growth (5Y CAGR) ⓘ | N/A | -18.21% |
| Margin Growth (5Y Trend) ⓘ | 42.88% | -0.23% |
| FCF Growth (5Y CAGR) ⓘ | N/A | 4.91% |
Quality (Business durability) | ||
| ROIC (Latest) ⓘ | 16.76% | 12.61% |
| ROIC (5Y Median) ⓘ | 11.00% | 10.72% |
| Net Debt / EBIT (Latest) ⓘ | 3.84 | 2.10 |
| Net Debt / EBIT (5Y Median) ⓘ | 3.76 | 2.32 |
| Operating Margin (Latest) ⓘ | 22.57% | 9.25% |
| Operating Margin (5Y Median) ⓘ | 22.73% | 9.64% |
| Debt to Equity (Latest) ⓘ | 2626.85% | 75.78% |
| Profit Margin (Latest) ⓘ | 12.59% | 5.33% |
| Free Cash Flow (Latest) ⓘ | $2.79B | |
Momentum (Price trend) | ||
| 3Y Return ⓘ | -7.15% | +14.53% |
| 12M Return (excl. last month) ⓘ | -13.40% | +3.08% |
| 6M Return ⓘ | -19.24% | +0.55% |
| Price vs. 200-Day MA ⓘ | -19.53% | -0.54% |
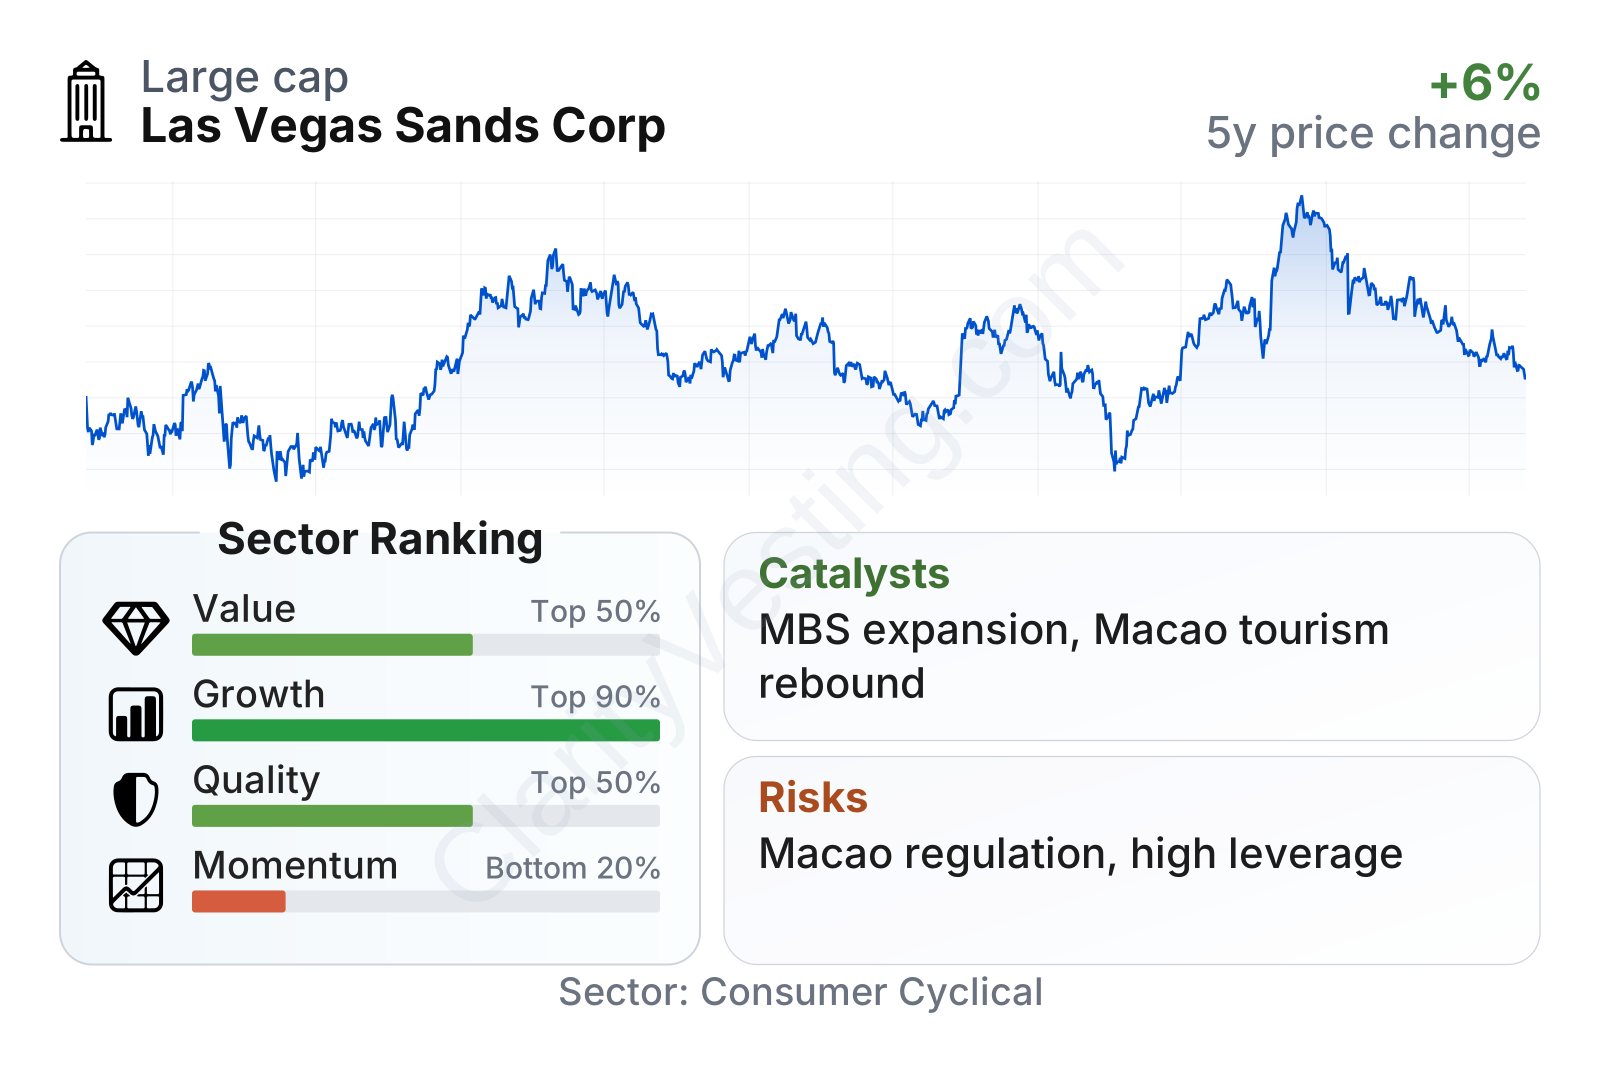
Las Vegas Sands stands out as a large company in the resorts and casinos space with a relatively modest share-price volatility versus the broader market. The most balanced part of the profile is valuation: earnings and cash-flow-based measures are close to, or slightly better than, the sector median. Quality is also solid, helped by strong operating margins and returns on invested capital that sit above many peers.
The most attractive area is long-term operating recovery. Five-year revenue per share growth and margin improvement are much stronger than the typical company in the sector, reflecting the rebound of Macao and Singapore after travel restrictions ended. The weaker area is market momentum: the share price has lagged over the last several months and multi-year periods, showing that the market still has doubts about the pace and durability of growth.
Growth
The company operates in a sector that can grow, but it is not a simple straight-line growth business. Resort and casino demand depends on tourism, consumer spending, air travel, regulation, and local economic conditions. That said, Las Vegas Sands is positioned in two markets with structural advantages. Macao remains the only place in China where casino gambling is legal, which gives it unique access to Chinese leisure and premium gaming demand. Singapore is one of Asia’s strongest travel and business hubs, and Marina Bay Sands has a premium location that is difficult to replicate.
Las Vegas Sands’ strategy is sensible for future growth because it focuses on high-quality, high-barrier assets rather than rapid expansion into many markets. In Macao, the company has been investing in property upgrades, premium rooms, entertainment, and convention capacity to attract more mass-market and premium-mass customers. In Singapore, the company continues to develop the Marina Bay Sands franchise, which has historically generated exceptionally strong returns and pricing power.
Recent revenue trends show the main pattern clearly: a very strong rebound in 2023, slower comparisons in 2024, then mixed but still generally healthy movement afterward. That is normal after a reopening surge. What matters more for long-term analysis is that revenue remains far above the depressed pandemic years and that the business has rebuilt a much stronger earnings base than it had in 2021 and 2022.
Cash generation is another important growth signal. Free cash flow moved from negative territory during the weak period to well above $2 billion more recently. That gives the company more flexibility to fund capital projects, support shareholder returns, and manage debt. For a resort operator, this is especially important because large properties require regular reinvestment to remain competitive.
A meaningful catalyst is the planned multiyear expansion at Marina Bay Sands. Management and company filings have continued to frame Singapore as a major long-term opportunity, including additional luxury capacity and entertainment offerings. Another catalyst is continued normalization in Macao visitation, especially if mass-market and premium-mass demand remain stronger than the more volatile VIP segment. The company also benefits if China outbound travel and consumer activity continue improving over time.
Recent company communications also indicate continued emphasis on capital returns through share repurchases and dividends, which can support per-share performance when backed by durable cash flow. That is not a growth engine by itself, but it does matter when a mature business generates substantial cash.
Risks
This article is for informational purposes only and does not constitute financial advice. Some content is AI-generated. See Disclaimer


