Stock Analysis · Life Time Group Holdings Inc (LTH)
Overview
Life Time Group Holdings Inc. operates large athletic country clubs that combine fitness, personal training, group classes, swimming, pickleball, spa services, coworking-style spaces, kids programs, and food and beverage offerings in one location. The company positions its centers as premium wellness destinations rather than traditional low-cost gyms. Its model is built around recurring memberships, with additional spending opportunities once members are inside the club ecosystem.
Revenue is primarily generated from membership dues and in-center spending. Based on recent annual reporting and company disclosures, the business mix is heavily centered on club operations, with the largest sources of revenue approximately structured as follows:
- Membership dues and enrollment fees: about 70% to 75% of revenue. This includes recurring access fees paid by individual and family members.
- In-center revenue: about 20% to 25% of revenue. This typically includes personal training, small-group training, spa services, tennis and pickleball programs, kids activities, and food and beverage purchases.
- Other revenue: about 3% to 7% of revenue. This can include corporate wellness relationships, media-related activities, and other smaller ancillary streams.
The business is capital intensive because each location is large, amenity-rich, and expensive to build or expand. That makes the company different from many gym chains: it aims for higher spending per member and lower churn among affluent households, but it also requires more up-front investment and carries more balance-sheet risk.
The financial flow over the last several years shows a meaningful improvement in scale and profitability. Revenue has risen strongly since 2021, operating income has moved from losses to healthy profits, and interest expense has become less of a drag by 2025. That progression suggests the company is getting better operating leverage as mature clubs fill up and newer locations contribute more meaningfully.
Key Figures
| Metric | Value | Sector ⓘ |
|---|---|---|
| Date | Sep 12, 2026 | |
| Context | ||
| Sector | Consumer Cyclical | |
| Industry | Leisure | |
| Market Cap ⓘ | $9.27B | |
| Beta ⓘ | 1.48 | |
Value (Cheapness) | ||
| P/E Ratio ⓘ | 22.79 | 17.10 |
| FCF Yield ⓘ | -1.63% | 8.53% |
| EBIT / EV ⓘ | 4.61% | 6.46% |
| PEG ⓘ | N/A | |
Growth (Business expansion) | ||
| Revenue Growth ⓘ | 13.70% | 5.75% |
| RPS Growth (5Y CAGR) ⓘ | 18.10% | 9.14% |
| EPS Growth (5Y CAGR) ⓘ | N/A | -18.21% |
| Margin Growth (5Y Trend) ⓘ | 54.05% | -0.23% |
| FCF Growth (5Y CAGR) ⓘ | -50.49% | 4.91% |
Quality (Business durability) | ||
| ROIC (Latest) ⓘ | 9.72% | 12.61% |
| ROIC (5Y Median) ⓘ | 4.45% | 10.72% |
| Net Debt / EBIT (Latest) ⓘ | 6.55 | 2.10 |
| Net Debt / EBIT (5Y Median) ⓘ | 15.98 | 2.32 |
| Operating Margin (Latest) ⓘ | 19.38% | 9.25% |
| Operating Margin (5Y Median) ⓘ | 10.18% | 9.64% |
| Debt to Equity (Latest) ⓘ | 129.11% | 75.78% |
| Profit Margin (Latest) ⓘ | 13.04% | 5.33% |
| Free Cash Flow (Latest) ⓘ | -$150.95M | |
Momentum (Price trend) | ||
| 3Y Return ⓘ | +156.33% | +14.53% |
| 12M Return (excl. last month) ⓘ | +58.77% | +3.08% |
| 6M Return ⓘ | +61.23% | +0.55% |
| Price vs. 200-Day MA ⓘ | +26.72% | -0.54% |
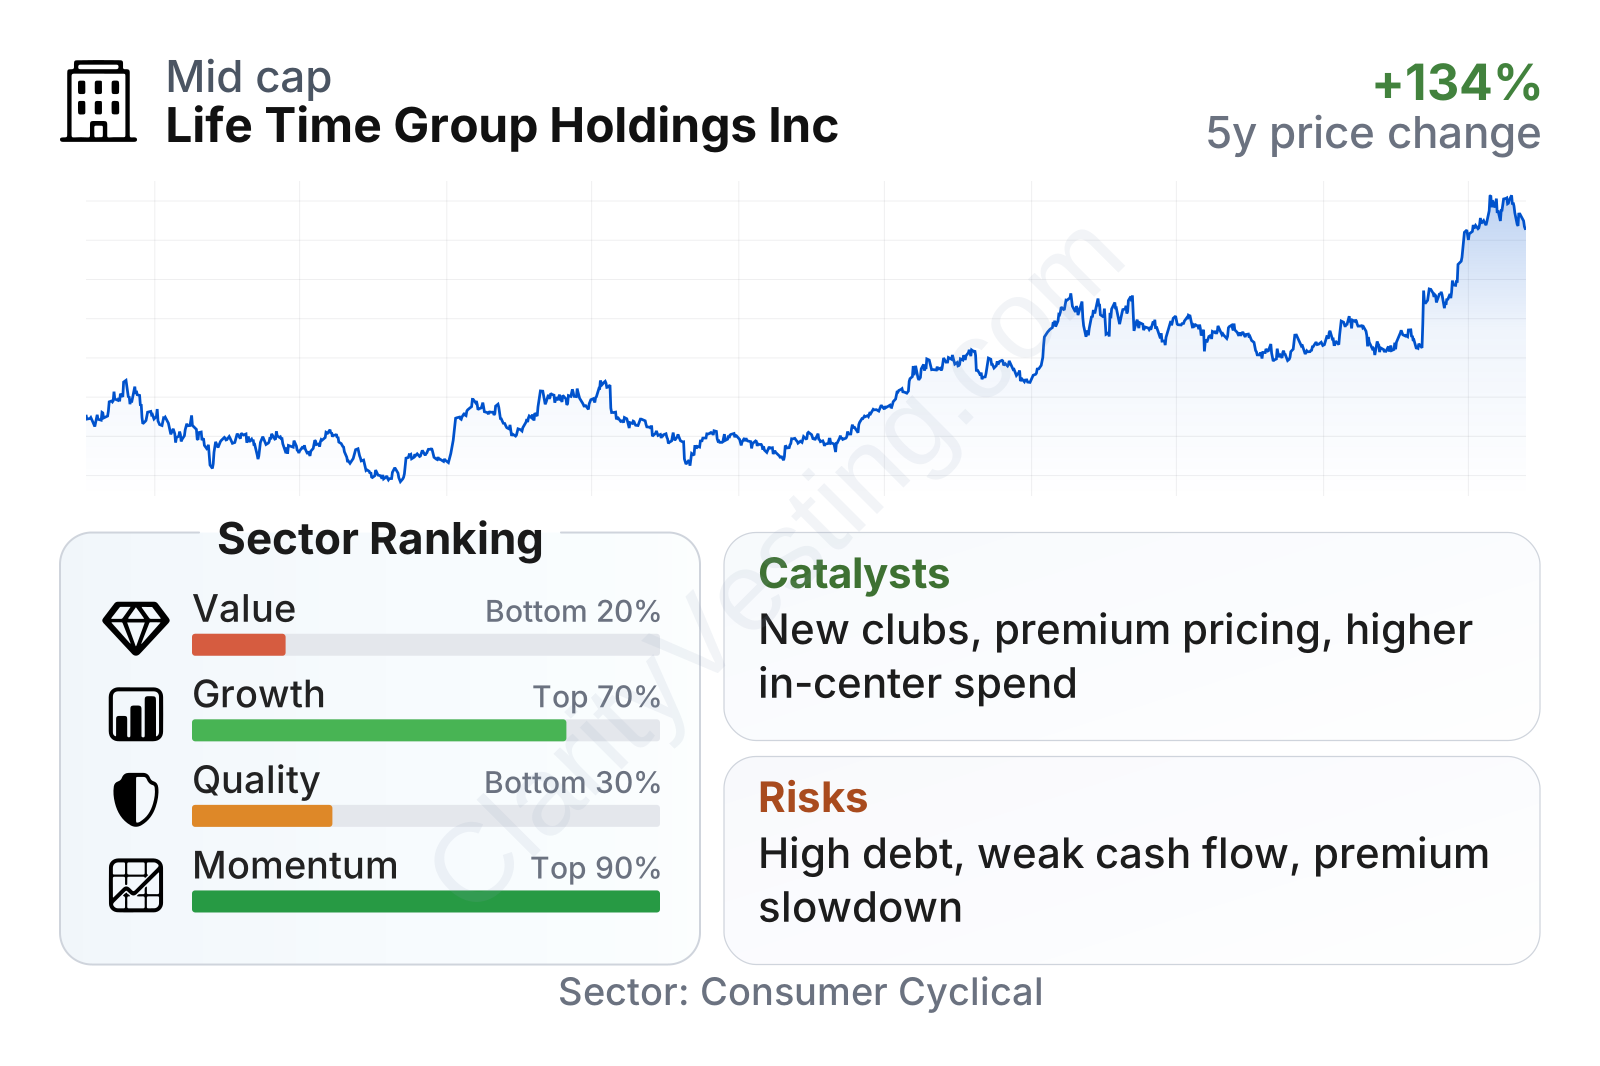
Life Time is now a large public company with a market value around $10 billion, but it still trades with the characteristics of a growth-oriented operator rather than a mature defensive business. The stock has been strong over the last three years and especially strong more recently, which places its momentum near the top of the broader consumer discretionary group. By contrast, the value profile looks weak relative to the sector, largely because earnings and cash flow multiples remain demanding and free cash flow is currently negative.
The mixed picture is important. Growth and market performance stand out positively, while leverage and cash conversion remain the main areas where the company still looks less comfortable than many peers. Operationally, margins have improved a lot, but the balance between expansion spending and cash generation is still a key issue to watch.
Growth
Life Time operates in the broader wellness, fitness, and premium experiences market, which has favorable long-term characteristics. Consumers have shown sustained interest in health, longevity, recovery, and community-based fitness. Within that trend, the company is targeting households willing to pay for a more complete offering than a basic gym membership. That part of the market is smaller than the mass-market gym segment, but it can be more resilient if the customer base is affluent and engagement stays high.
The company’s strategy for growth appears coherent. It is not trying to compete on the lowest monthly price. Instead, it focuses on a premium model with larger clubs, broader services, and more opportunities to increase revenue per member. That can support growth through several levers at once: opening new centers, raising membership dues, increasing member penetration of personal training and other services, and improving utilization of existing locations.
Revenue growth has cooled from the post-pandemic rebound phase, but it remains solid. Recent year-over-year growth has stayed in the low-to-mid teens, still well above the sector median of roughly 6%. Over a five-year period, revenue per share growth has also been notably stronger than the typical company in the sector, which supports the view that expansion is not just cyclical recovery but also reflects real business development.
Free cash flow is the main complication in the growth case. The company has shown that earnings can improve sharply, yet free cash flow has been uneven and recently negative again after turning positive for a period. For a business expanding its physical footprint, that usually means capital expenditures remain heavy. In simple terms, Life Time is producing better accounting profits, but a meaningful share of cash is still being reinvested into clubs, developments, and related infrastructure.
A notable catalyst is the company’s continued ability to grow same-center revenue while also adding new locations in attractive, higher-income trade areas. Another potential growth driver is the wider monetization of services beyond base memberships, especially training, racquet sports, wellness, and digital or media-adjacent offerings. If those higher-value services continue to scale, they can lift average revenue per membership without requiring the same pace of square-footage growth.
Recent company updates have also pointed to ongoing demand strength, membership growth, and pricing discipline. For a premium operator, evidence that members continue to join and spend more even after price increases is a significant signal, because it suggests brand positioning is holding up rather than relying on discounting.
Risks
This article is for informational purposes only and does not constitute financial advice. Some content is AI-generated. See Disclaimer


