Stock Analysis · Liquidity Services Inc (LQDT)
Overview
Liquidity Services Inc operates online marketplaces that help businesses, government agencies, and other organizations sell surplus, returned, and idle assets. In simple terms, it is a digital middleman for goods that are no longer needed by their original owner. Those goods can range from consumer products and truckloads of retail inventory to heavy equipment, industrial machinery, and even real estate-related assets in some cases. The company earns money by connecting sellers and buyers, managing the selling process, and providing services such as valuation, logistics, and refurbishment.
The business is organized around several marketplaces and service lines. Based on the latest annual filing and segment reporting, revenue is mainly generated from the following sources:
- Retail Supply Chain Group (RSCG): approximately 50% to 55% of revenue. This segment helps retailers and consumer brands sell returned, excess, and overstock inventory through business-to-business channels.
- Capital Assets Group (CAG): approximately 25% to 30% of revenue. This includes the sale of commercial, industrial, and government surplus assets such as machinery, vehicles, and equipment.
- GovDeals / Government-related marketplaces: approximately 15% to 20% of revenue. This business supports local and state governments, schools, and public agencies in selling surplus property and equipment.
- Other service and marketplace revenue: a smaller share, including value-added services tied to asset recovery, fulfillment, and transaction support.
Its revenue model is not based on making products. Instead, it typically earns commissions, service fees, and in some cases proceeds from inventory it owns and resells. That creates a business mix that is partly transactional and partly service-based. Over the last several years, the company has expanded total revenue meaningfully, but the mix has also shifted, with cost of revenue rising as the company handled more volume in inventory-heavy activities.
The overall picture is of a niche e-commerce platform focused on the circular economy: helping organizations recover value from goods that would otherwise sit unused, be liquidated inefficiently, or be discarded.
Revenue has grown strongly from the low-$200 millions earlier in the decade to the mid-$400 millions more recently. Gross profit also increased, although not as fast as total revenue, which suggests a greater contribution from lower-margin inventory resale activity alongside the marketplace and service model.
Key Figures
| Metric | Value | Sector ⓘ |
|---|---|---|
| Date | Sep 12, 2026 | |
| Context | ||
| Sector | Consumer Cyclical | |
| Industry | Internet Retail | |
| Market Cap ⓘ | $1.33B | |
| Beta ⓘ | 1.08 | |
Value (Cheapness) | ||
| P/E Ratio ⓘ | 41.66 | 17.10 |
| FCF Yield ⓘ | 6.76% | 8.53% |
| EBIT / EV ⓘ | 4.52% | 6.46% |
| PEG ⓘ | 1.78 | |
Growth (Business expansion) | ||
| Revenue Growth ⓘ | 8.10% | 5.75% |
| RPS Growth (5Y CAGR) ⓘ | 18.92% | 9.14% |
| EPS Growth (5Y CAGR) ⓘ | 9.67% | -18.21% |
| Margin Growth (5Y Trend) ⓘ | -2.43% | -0.23% |
| FCF Growth (5Y CAGR) ⓘ | -0.42% | 4.91% |
Quality (Business durability) | ||
| ROIC (Latest) ⓘ | 15.18% | 12.61% |
| ROIC (5Y Median) ⓘ | 13.39% | 10.72% |
| Net Debt / EBIT (Latest) ⓘ | -4.21 | 2.10 |
| Net Debt / EBIT (5Y Median) ⓘ | -3.81 | 2.32 |
| Operating Margin (Latest) ⓘ | 9.99% | 9.25% |
| Operating Margin (5Y Median) ⓘ | 8.27% | 9.64% |
| Debt to Equity (Latest) ⓘ | 5.76% | 75.78% |
| Profit Margin (Latest) ⓘ | 6.79% | 5.33% |
| Free Cash Flow (Latest) ⓘ | $89.99M | |
Momentum (Price trend) | ||
| 3Y Return ⓘ | +137.24% | +14.53% |
| 12M Return (excl. last month) ⓘ | +72.51% | +3.08% |
| 6M Return ⓘ | +45.41% | +0.55% |
| Price vs. 200-Day MA ⓘ | +22.21% | -0.54% |
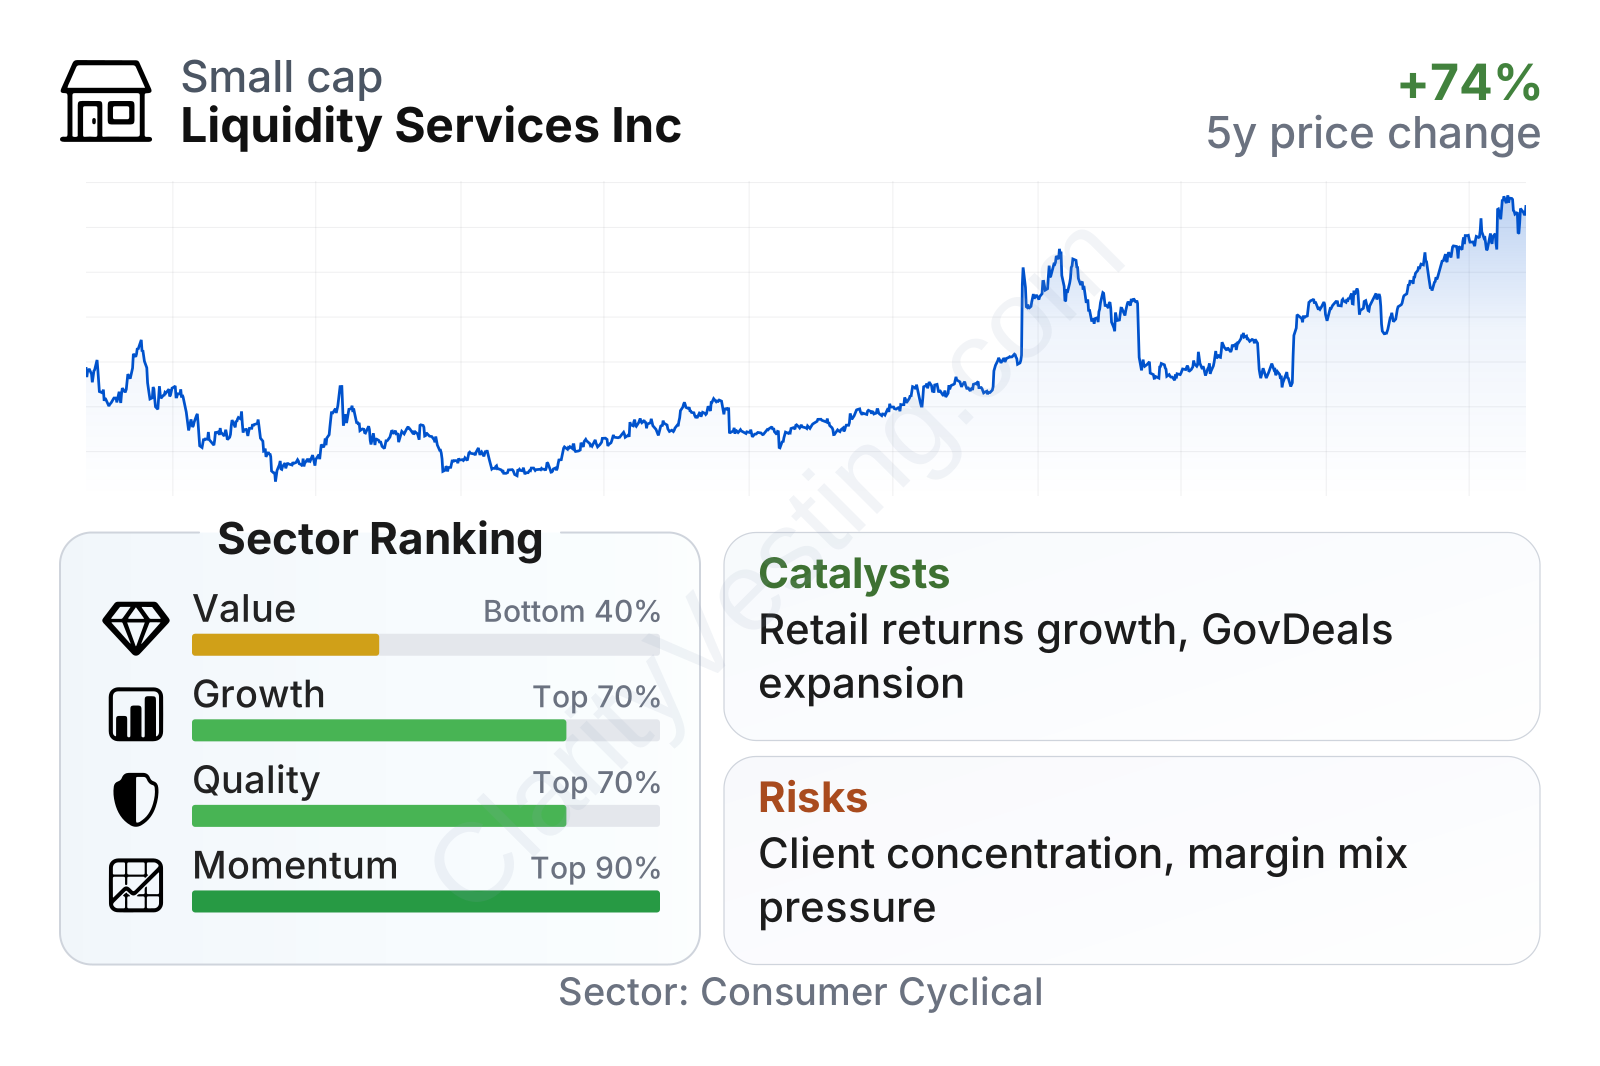
Liquidity Services is a small-cap company with market value a little above $1 billion and a stock volatility close to the broader market. The overall profile is mixed but understandable: growth, quality, and price momentum rank relatively well against the sector, while pure valuation measures look less attractive. Profitability is respectable, with operating margin around 10% and profit margin near 7%, both modestly above sector medians. Balance-sheet strength stands out more clearly, with very low leverage and net cash rather than meaningful net debt.
The stock’s multi-year performance has been strong, but that strength has pushed the earnings multiple well above the sector median. In other words, the market is giving the company credit for execution, but that also leaves less room for disappointment.
Growth
Liquidity Services operates in areas that have attractive long-term drivers. Retail returns remain a large and recurring issue for merchants, and businesses increasingly want structured ways to recover value from excess inventory instead of simply discounting or scrapping it. At the same time, governments and industrial companies are under pressure to improve efficiency, reduce waste, and document asset disposal more carefully. Those trends support demand for digital marketplaces that can handle resale, compliance, and recovery at scale.
The company’s strategy broadly fits that environment. It has built specialized platforms for different seller types rather than relying on a one-size-fits-all marketplace. That matters because selling returned consumer goods is very different from selling a fire truck, warehouse equipment, or energy infrastructure. Its operating model also benefits from network effects at a niche level: more sellers attract more buyers, and deeper buyer pools can improve recovery rates for sellers.
Growth has not been perfectly smooth, but the trend has been favorable. Recent year-over-year revenue growth is still positive at around 8%, above the sector median, and the longer-term revenue-per-share growth rate is notably stronger than many peers. There were periods of exceptionally strong expansion followed by normalization, which is common in a transaction-driven business. What matters more for a long-term view is that the company has shown an ability to scale revenue over several years rather than relying on a single short-lived spike.
Cash generation is another encouraging point. Free cash flow has improved sharply in the most recent period, rising from a level around the mid-$40 millions historically to roughly the upper-$70 millions. That suggests the recent expansion is not just accounting-based growth. Stronger cash conversion gives the company more flexibility to invest in technology, pursue acquisitions, or simply build resilience for softer demand periods.
A notable catalyst has been the expansion of programs tied to retail returns and supply chain optimization. In a market where retailers want to minimize write-downs and recover more value from returned goods, Liquidity Services is positioned as an outsourced solution rather than just an auction website. Its GovDeals platform also gives it exposure to public-sector digitization, where many agencies are still early in the shift from offline surplus sales to software-supported disposal channels.
Risks
This article is for informational purposes only and does not constitute financial advice. Some content is AI-generated. See Disclaimer


