Stock Analysis · Lenovo Group Ltd PK (LNVGY)
Overview
Lenovo Group is a global technology hardware and services company best known for personal computers, but its business is broader than that. It sells laptops, desktops, tablets, smartphones, monitors, workstations, and servers, and it also provides IT solutions and support services for businesses. The company operates worldwide and has built a large presence in both consumer devices and enterprise infrastructure.
Its revenue base is still led by PCs and related devices, with infrastructure and services becoming more important over time. Based on Lenovo’s latest annual reporting structure, the business can be viewed roughly as follows:
- Intelligent Devices Group – around 75% to 80% of revenue. This includes PCs, tablets, smartphones, accessories, and other smart devices.
- Infrastructure Solutions Group – around 10% to 15% of revenue. This covers servers, storage, and other data center products.
- Solutions and Services Group – around 8% to 10% of revenue. This includes support, managed services, and other recurring enterprise services.
That mix matters because PCs remain a large but mature category, while infrastructure and services are the areas that can gradually improve stability and lift profitability. The business flow also shows a company with very large sales volume, thin margins, and meaningful spending on research and operating expenses. Revenue and gross profit rebounded strongly in the latest year, and operating income recovered as well, which suggests the post-downturn reset in the PC market has turned into a new expansion phase.
Key Figures
| Metric | Value | Sector ⓘ |
|---|---|---|
| Date | Sep 12, 2026 | |
| Context | ||
| Sector | Technology | |
| Industry | Computer Hardware | |
| Market Cap ⓘ | $50.33B | |
| Beta ⓘ | 1.13 | |
Value (Cheapness) | ||
| P/E Ratio ⓘ | 29.37 | 29.51 |
| FCF Yield ⓘ | 3.93% | 4.25% |
| EBIT / EV ⓘ | 4.01% | 2.85% |
| PEG ⓘ | 0.84 | |
Growth (Business expansion) | ||
| Revenue Growth ⓘ | 43.10% | 15.40% |
| RPS Growth (5Y CAGR) ⓘ | 0.73% | 8.56% |
| EPS Growth (5Y CAGR) ⓘ | -4.27% | -11.88% |
| Margin Growth (5Y Trend) ⓘ | -0.40% | 0.46% |
| FCF Growth (5Y CAGR) ⓘ | 0.73% | 9.80% |
Quality (Business durability) | ||
| ROIC (Latest) ⓘ | N/A | 9.44% |
| ROIC (5Y Median) ⓘ | 24.26% | 8.30% |
| Net Debt / EBIT (Latest) ⓘ | 0.36 | 0.54 |
| Net Debt / EBIT (5Y Median) ⓘ | 0.19 | 0.44 |
| Operating Margin (Latest) ⓘ | 2.28% | 9.58% |
| Operating Margin (5Y Median) ⓘ | 3.83% | 8.25% |
| Debt to Equity (Latest) ⓘ | 100.00% | 33.33% |
| Profit Margin (Latest) ⓘ | 0.88% | 7.14% |
| Free Cash Flow (Latest) ⓘ | $1.98B | |
Momentum (Price trend) | ||
| 3Y Return ⓘ | +338.06% | +45.48% |
| 12M Return (excl. last month) ⓘ | +161.07% | +23.48% |
| 6M Return ⓘ | +245.36% | +20.93% |
| Price vs. 200-Day MA ⓘ | +104.76% | +7.43% |
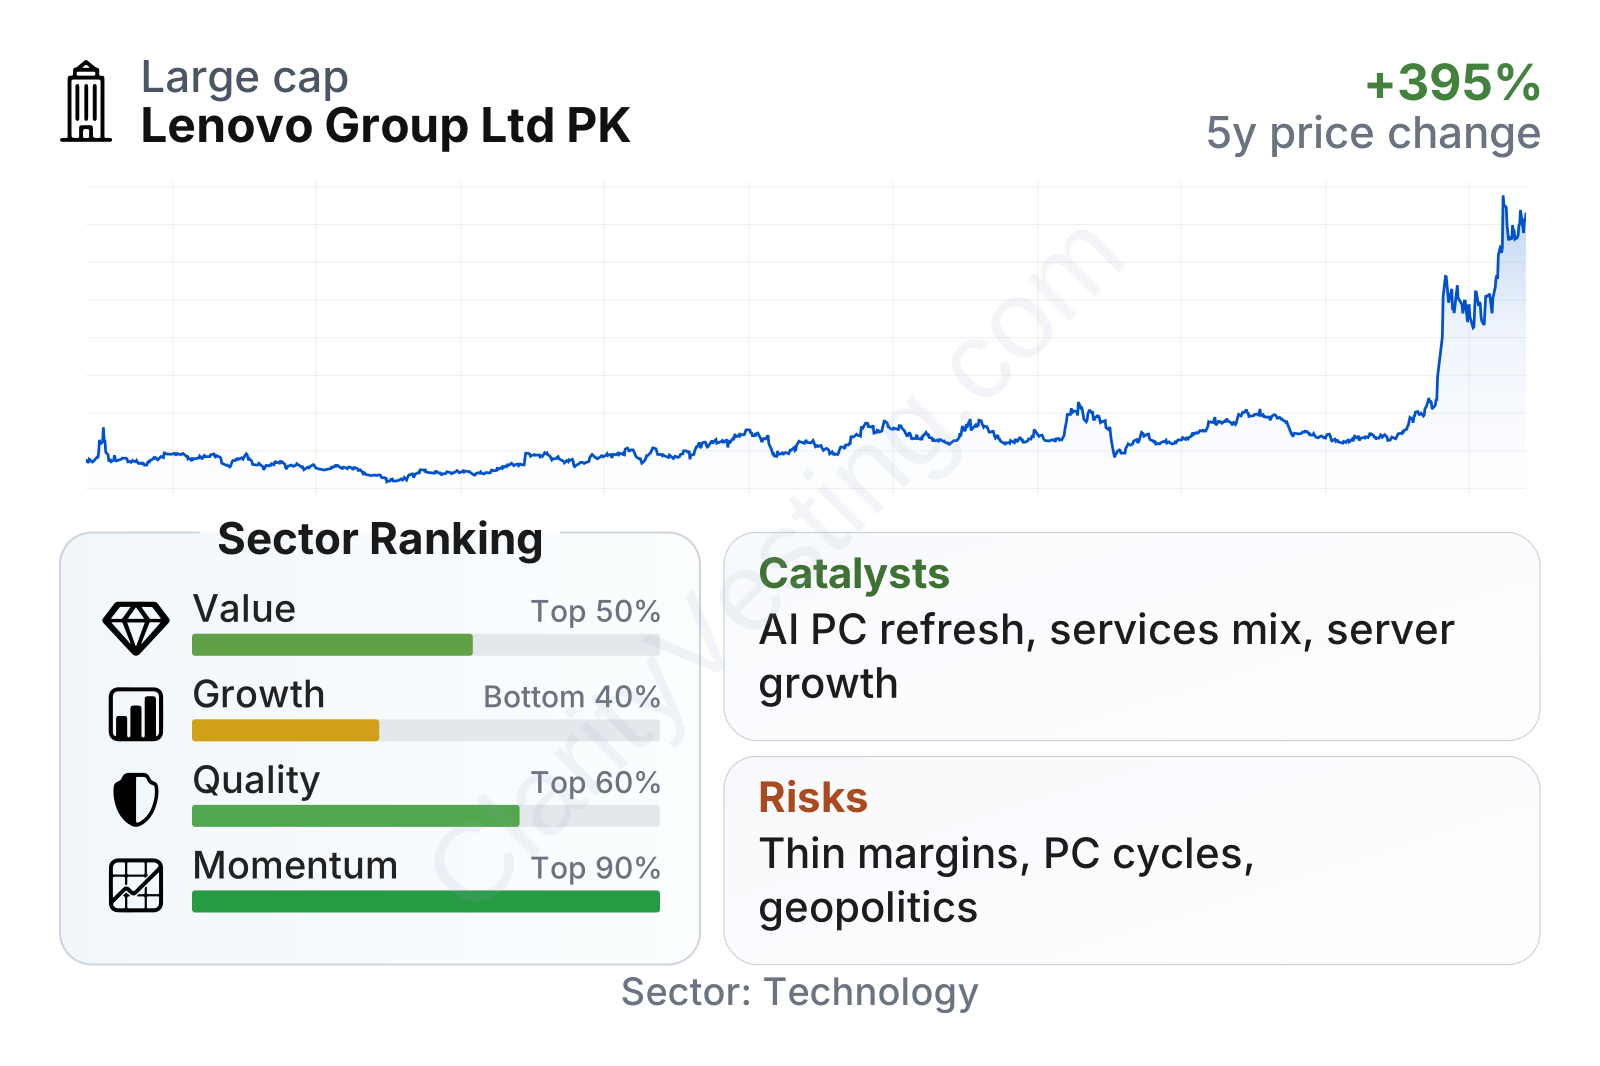
Lenovo’s current profile looks mixed in a fairly typical way for a large hardware company. On valuation, it screens cheaper than much of the technology sector, with stronger cash flow yield and a solid earnings multiple relative to peers. On quality, the picture is more nuanced: returns on invested capital have been strong over time and net debt remains manageable relative to earnings, but margins are notably lower than the sector median. Growth indicators show a sharp recent rebound in revenue, yet the longer five-year trend is less impressive, reflecting how cyclical Lenovo’s end markets can be. Market performance has been strong over the last several years and especially over the last six to twelve months, showing that expectations have already improved materially.
Growth
Lenovo operates in sectors that are mature in some areas and expanding in others. Traditional PCs do not usually deliver explosive long-term growth, but they can still benefit from replacement cycles, corporate refresh demand, and higher-value products such as AI-capable devices and premium commercial systems. The more interesting growth angle is Lenovo’s effort to become less dependent on PCs by expanding infrastructure and services, especially where enterprise customers want integrated hardware, support, and lifecycle management.
The revenue trend shows a deep slump followed by a strong recovery. That rebound is important because it suggests Lenovo has moved through the post-pandemic inventory correction that hit the PC industry. Recent year-over-year growth has been well above the broader sector median, which points to genuine momentum rather than just a flat market environment. Still, the longer history shows that this is not a smooth compounding story; it is a business that can recover quickly, but one that also moves with industry cycles.
One of the clearest strategic catalysts is the industry push around AI-enabled personal computers and edge-to-cloud infrastructure. Lenovo has been emphasizing AI PCs, hybrid infrastructure, and enterprise services in its recent communications, trying to position itself where device upgrades and data workloads intersect. If businesses refresh fleets to run more AI features locally, that could support higher average selling prices and a healthier mix in commercial PCs. In enterprise hardware, demand tied to AI workloads can also help servers and related infrastructure.
Cash generation deserves a careful reading. Lenovo has produced meaningful free cash flow over time, but the recent multi-year path has been uneven and trended down before the latest trailing figure improved. That pattern fits the nature of a hardware company exposed to inventory, working capital swings, and changing demand conditions. The positive point is that free cash flow yield remains strong relative to much of the sector, which means the business is still converting a substantial portion of its market value into cash, even if year-to-year consistency has not been ideal.
Another growth support is scale. Lenovo remains one of the largest PC makers in the world, and that gives it purchasing power, channel reach, and brand visibility. In a hardware market where size matters, those advantages can help the company capture recovery periods more effectively than smaller competitors.
Risks
This article is for informational purposes only and does not constitute financial advice. Some content is AI-generated. See Disclaimer


