Stock Analysis · LKQ Corporation (LKQ)
Overview
LKQ Corporation is a large distributor of vehicle replacement parts, specialty aftermarket products, and recycled components. In simple terms, the company helps repair shops, insurers, dealerships, collision centers, and do-it-yourself customers keep cars and trucks on the road. Its business is built around a broad catalog of parts, a large distribution network, and access to alternative parts that can be cheaper than brand-new original equipment from automakers.
The company operates mainly in North America and Europe. Its offering includes recycled mechanical parts taken from salvage vehicles, aftermarket collision parts, refurbished components, paint and related materials, and specialty equipment and accessories used in performance, off-road, and recreational vehicles. This gives LKQ exposure to both essential repair demand and more discretionary enthusiast spending.
Based on recent company reporting, LKQ’s revenue sources are organized broadly as follows:
- Wholesale – North America: approximately 44% to 46% of revenue. This is the largest segment and includes aftermarket and recycled parts sold mainly to repair shops and insurers.
- Europe: approximately 40% to 42% of revenue. This business distributes replacement parts and services across many European countries.
- Specialty: approximately 11% to 13% of revenue. This segment focuses on specialty equipment, accessories, and products tied to enthusiast and recreational vehicle categories.
- Self Service: approximately 2% to 3% of revenue. This business allows customers to pull parts directly from salvage yards.
One useful way to understand LKQ is that it sits between car owners, repair channels, insurers, and parts suppliers. That position can be attractive because vehicle repairs remain necessary even when consumers delay buying new cars. At the same time, LKQ’s mix is not purely defensive: specialty products and some European demand can be more sensitive to economic conditions.
The long-term financial profile shows a business with very large sales, but also a clear squeeze on profitability in recent years. Revenue rose from roughly $13 billion in 2021 to above $14 billion in 2024 before easing back in 2025, while net income fell materially from just above $1.0 billion in 2021–2022 to about $0.6 billion in 2025. That suggests the company has maintained scale, but not all of that scale has translated into earnings.
The operating picture shows that LKQ still converts a sizable portion of sales into gross profit, but rising operating costs and much higher interest expense have reduced the amount left for shareholders. That margin compression is a central point for any long-term analysis.
Key Figures
| Metric | Value | Sector ⓘ |
|---|---|---|
| Date | Sep 12, 2026 | |
| Context | ||
| Sector | Consumer Cyclical | |
| Industry | Auto Parts | |
| Market Cap ⓘ | $5.98B | |
| Beta ⓘ | 0.84 | |
Value (Cheapness) | ||
| P/E Ratio ⓘ | 13.43 | 17.10 |
| FCF Yield ⓘ | 10.45% | 8.53% |
| EBIT / EV ⓘ | 7.84% | 6.46% |
| PEG ⓘ | 1.06 | |
Growth (Business expansion) | ||
| Revenue Growth ⓘ | -3.00% | 5.75% |
| RPS Growth (5Y CAGR) ⓘ | 5.45% | 9.14% |
| EPS Growth (5Y CAGR) ⓘ | -26.00% | -18.21% |
| Margin Growth (5Y Trend) ⓘ | -3.70% | -0.23% |
| FCF Growth (5Y CAGR) ⓘ | -5.75% | 4.91% |
Quality (Business durability) | ||
| ROIC (Latest) ⓘ | 6.30% | 12.61% |
| ROIC (5Y Median) ⓘ | 11.81% | 10.72% |
| Net Debt / EBIT (Latest) ⓘ | 5.74 | 2.10 |
| Net Debt / EBIT (5Y Median) ⓘ | 3.68 | 2.32 |
| Operating Margin (Latest) ⓘ | 6.38% | 9.25% |
| Operating Margin (5Y Median) ⓘ | 10.45% | 9.64% |
| Debt to Equity (Latest) ⓘ | 82.41% | 75.78% |
| Profit Margin (Latest) ⓘ | 3.37% | 5.33% |
| Free Cash Flow (Latest) ⓘ | $625.00M | |
Momentum (Price trend) | ||
| 3Y Return ⓘ | -46.96% | +14.53% |
| 12M Return (excl. last month) ⓘ | -14.52% | +3.08% |
| 6M Return ⓘ | -17.04% | +0.55% |
| Price vs. 200-Day MA ⓘ | -14.05% | -0.54% |
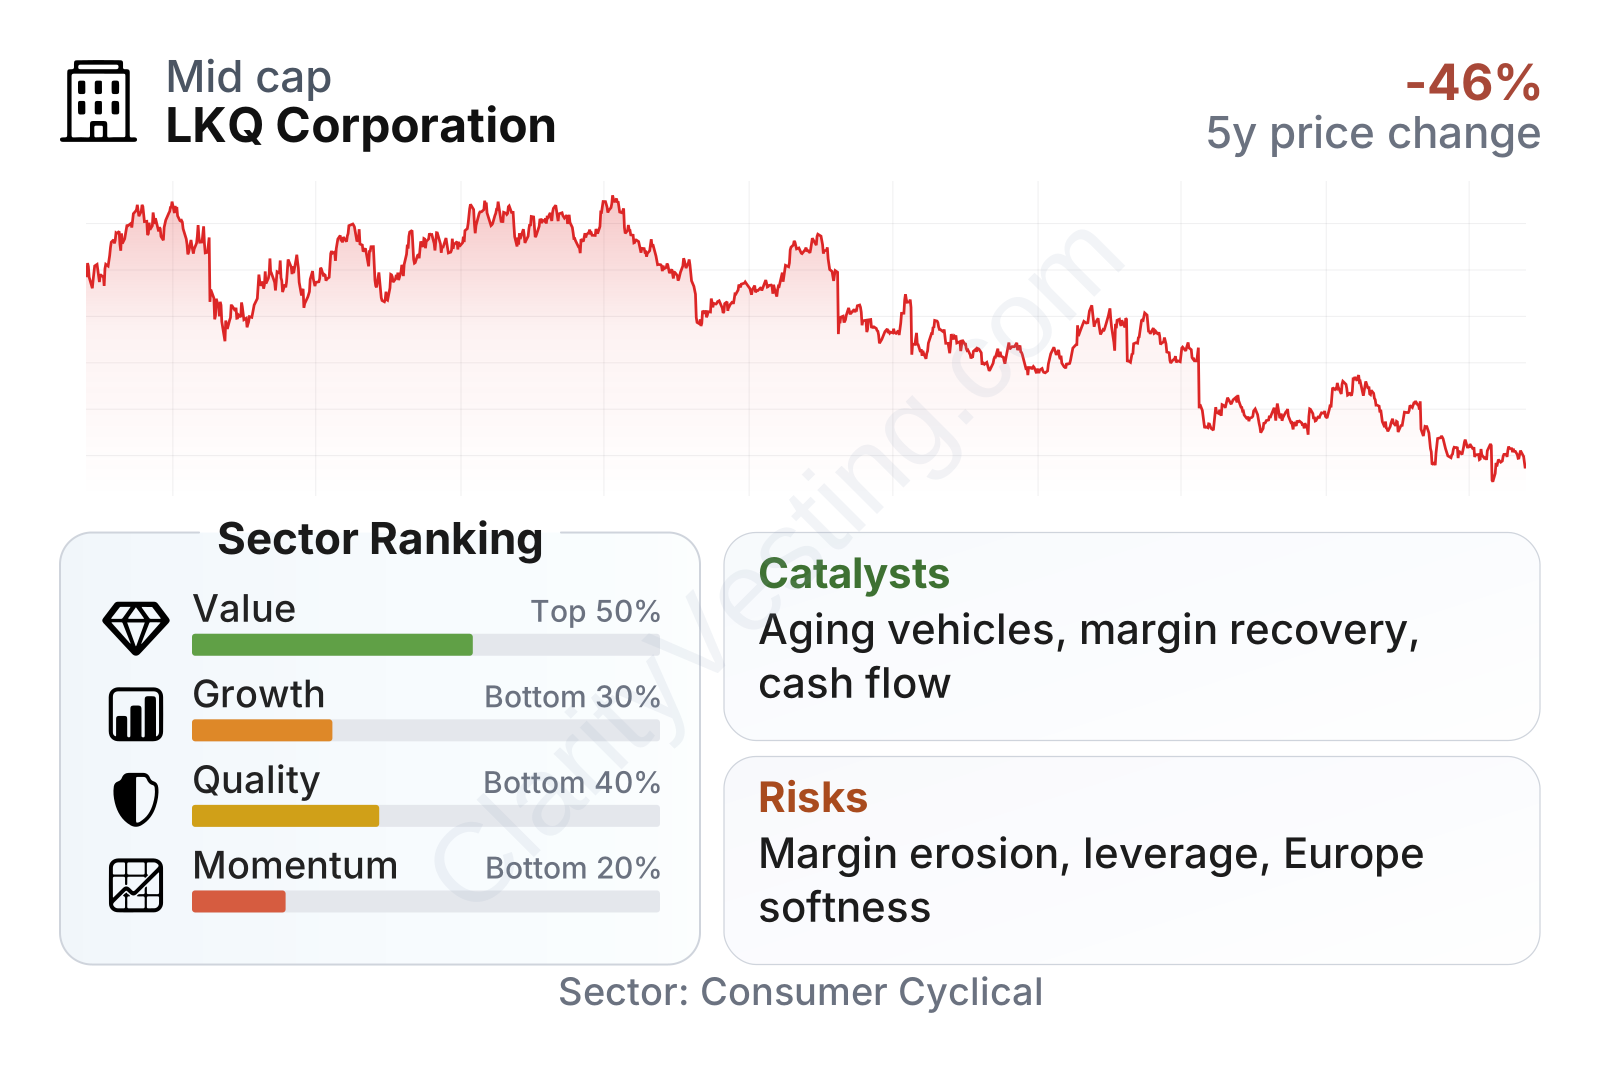
LKQ is a mid-to-large-sized company in its sector, and its share price has been under noticeable pressure over the last three years. Recent market performance ranks near the bottom of the sector, which usually signals that investors are questioning earnings quality, growth, or both. At the same time, the valuation indicators look less demanding than the sector median: the P/E ratio is around the low teens versus a sector median closer to the high teens, and cash-flow-based measures also compare favorably. In other words, the market is not pricing LKQ like a growth company, but more like a mature operator facing operational questions.
The mixed picture continues in the factor breakdown. Value metrics are relatively solid, helped by a free cash flow yield around 11% and EBIT relative to enterprise value above the sector median. Growth, quality, and momentum are weaker. Profitability has fallen below sector norms, returns on invested capital are modest on a trailing basis, and leverage remains elevated relative to earnings. That combination often points to a company that may look statistically inexpensive, but still needs operating improvement to change the market’s perception.
Growth
LKQ operates in a part of the auto market with some durable long-term supports. Vehicles are staying on the road longer, and an aging car parc generally creates more replacement-part demand. Insurers and repair shops also continue to look for lower-cost repair options, which supports recycled and alternative parts. These are favorable structural trends because they do not depend entirely on new car sales.
The strategy also has logic. LKQ benefits from scale in sourcing, inventory breadth, logistics, and customer relationships. In fragmented repair-part distribution markets, scale can matter a lot: customers want fast delivery, reliable availability, and competitive pricing. The company has also used acquisitions over many years to expand its network and purchasing power, particularly in Europe.
That said, the recent growth record is uneven. Revenue growth was strong in parts of 2023 and early 2024, but slowed sharply afterward and turned negative again in several recent periods, including a decline of about 6% year over year in the latest reading. That puts LKQ well below the sector’s median growth pace. For a long-term view, this means the sector backdrop may be supportive, but company-specific execution is currently more important than industry tailwinds alone.
Cash generation remains one of the more constructive elements. Free cash flow has been volatile, dropping meaningfully in 2025 and then recovering toward the $800 million range in the most recent trailing period. That recovery matters because it gives LKQ flexibility to reduce debt, fund buybacks, maintain acquisitions selectively, or invest in operations. A company with slow headline growth can still create value over time if it consistently produces healthy cash.
Another possible catalyst is the economic value proposition of alternative parts. As repair costs rise, insurers and consumers have stronger incentives to use recycled, remanufactured, or aftermarket components when regulations and repair standards allow. LKQ is well positioned to benefit from that cost-focused behavior because it has existing scale in those channels rather than needing to build them from scratch.
Recent company communications in 2026 have also emphasized operational discipline, efficiency actions, and portfolio management. The significance is not just cost cutting for its own sake. If LKQ can stabilize volumes and restore even part of its historical margin profile, earnings could improve faster than revenue because the company already has substantial infrastructure in place.
Risks
This article is for informational purposes only and does not constitute financial advice. Some content is AI-generated. See Disclaimer


