Stock Analysis · Liberty Broadband (LBRDA)
Overview
Liberty Broadband is a holding company whose main economic value comes from its ownership stake in Charter Communications, the cable and broadband operator behind the Spectrum brand. In simple terms, Liberty Broadband is not a traditional operating business with many separate products of its own. Instead, it is largely a vehicle through which shareholders get exposure to Charter, plus a smaller cable business called GCI that operates mainly in Alaska.
That structure matters because Liberty Broadband’s performance depends heavily on two things: the operating results and market value of Charter, and the cash generation of GCI. The company has also been simplifying over time, which makes it easier to understand but also increases concentration risk.
The company’s revenue is mainly generated from its consolidated operating subsidiary rather than from Charter itself, because the Charter stake is typically reflected more through earnings, asset value, and investment performance than through reported top-line revenue. Based on recent company reporting, the main economic sources tied to Liberty Broadband can be summarized as follows:
- GCI Holdings broadband and communications services: about 100% of reported revenue — This includes consumer and business broadband, wireless, video, and enterprise services in Alaska.
- Charter Communications equity ownership: dominant source of underlying asset value, but not a direct reported revenue line — This stake is the central reason many market participants follow Liberty Broadband. Its importance is much larger than reported revenue alone suggests.
- Other and corporate items: minimal — These are small compared with GCI and the Charter exposure.
From a business-model perspective, this means Liberty Broadband is best viewed as a concentrated media and telecom holding company with one operating asset and one very large strategic investment.
The financial flow over recent years shows a business that historically produced revenue close to $1.0 billion with solid gross profit, but 2025 stands out as a major break in pattern, with reported revenue dropping sharply and large losses appearing at both operating and net income levels. That kind of swing suggests restructuring, accounting changes, or major one-time items played an important role and makes recent numbers less straightforward than a normal telecom operator.
Key Figures
| Metric | Value | Sector ⓘ |
|---|---|---|
| Date | Aug 15, 2026 | |
| Context | ||
| Sector | Communication Services | |
| Industry | Telecom Services | |
| Market Cap ⓘ | $5.30B | |
| Beta ⓘ | 0.63 | |
Value (Cheapness) | ||
| P/E Ratio ⓘ | N/A | 18.46 |
| FCF Yield ⓘ | -4.68% | 12.89% |
| EBIT / EV ⓘ | N/A | 4.29% |
| PEG ⓘ | -657.00 | |
Growth (Business expansion) | ||
| Revenue Growth ⓘ | 6.10% | 5.50% |
| RPS Growth (5Y CAGR) ⓘ | -7.06% | 4.59% |
| EPS Growth (5Y CAGR) ⓘ | 22.03% | -18.07% |
| Margin Growth (5Y Trend) ⓘ | -575.31% | 0.60% |
| FCF Growth (5Y CAGR) ⓘ | N/A | 5.18% |
Quality (Business durability) | ||
| ROIC (Latest) ⓘ | N/A | 8.64% |
| ROIC (5Y Median) ⓘ | 0.18% | 8.14% |
| Net Debt / EBIT (Latest) ⓘ | N/A | 1.68 |
| Net Debt / EBIT (5Y Median) ⓘ | 3.35 | 2.93 |
| Operating Margin (Latest) ⓘ | N/A | 15.10% |
| Operating Margin (5Y Median) ⓘ | 2.87% | 13.00% |
| Debt to Equity (Latest) ⓘ | 32.63% | 57.59% |
| Profit Margin (Latest) ⓘ | N/A | 8.74% |
| Free Cash Flow (Latest) ⓘ | -$248.00M | |
Momentum (Price trend) | ||
| 3Y Return ⓘ | -55.33% | +41.98% |
| 12M Return (excl. last month) ⓘ | -64.67% | +2.68% |
| 6M Return ⓘ | -34.22% | +3.61% |
| Price vs. 200-Day MA ⓘ | -16.65% | +3.39% |
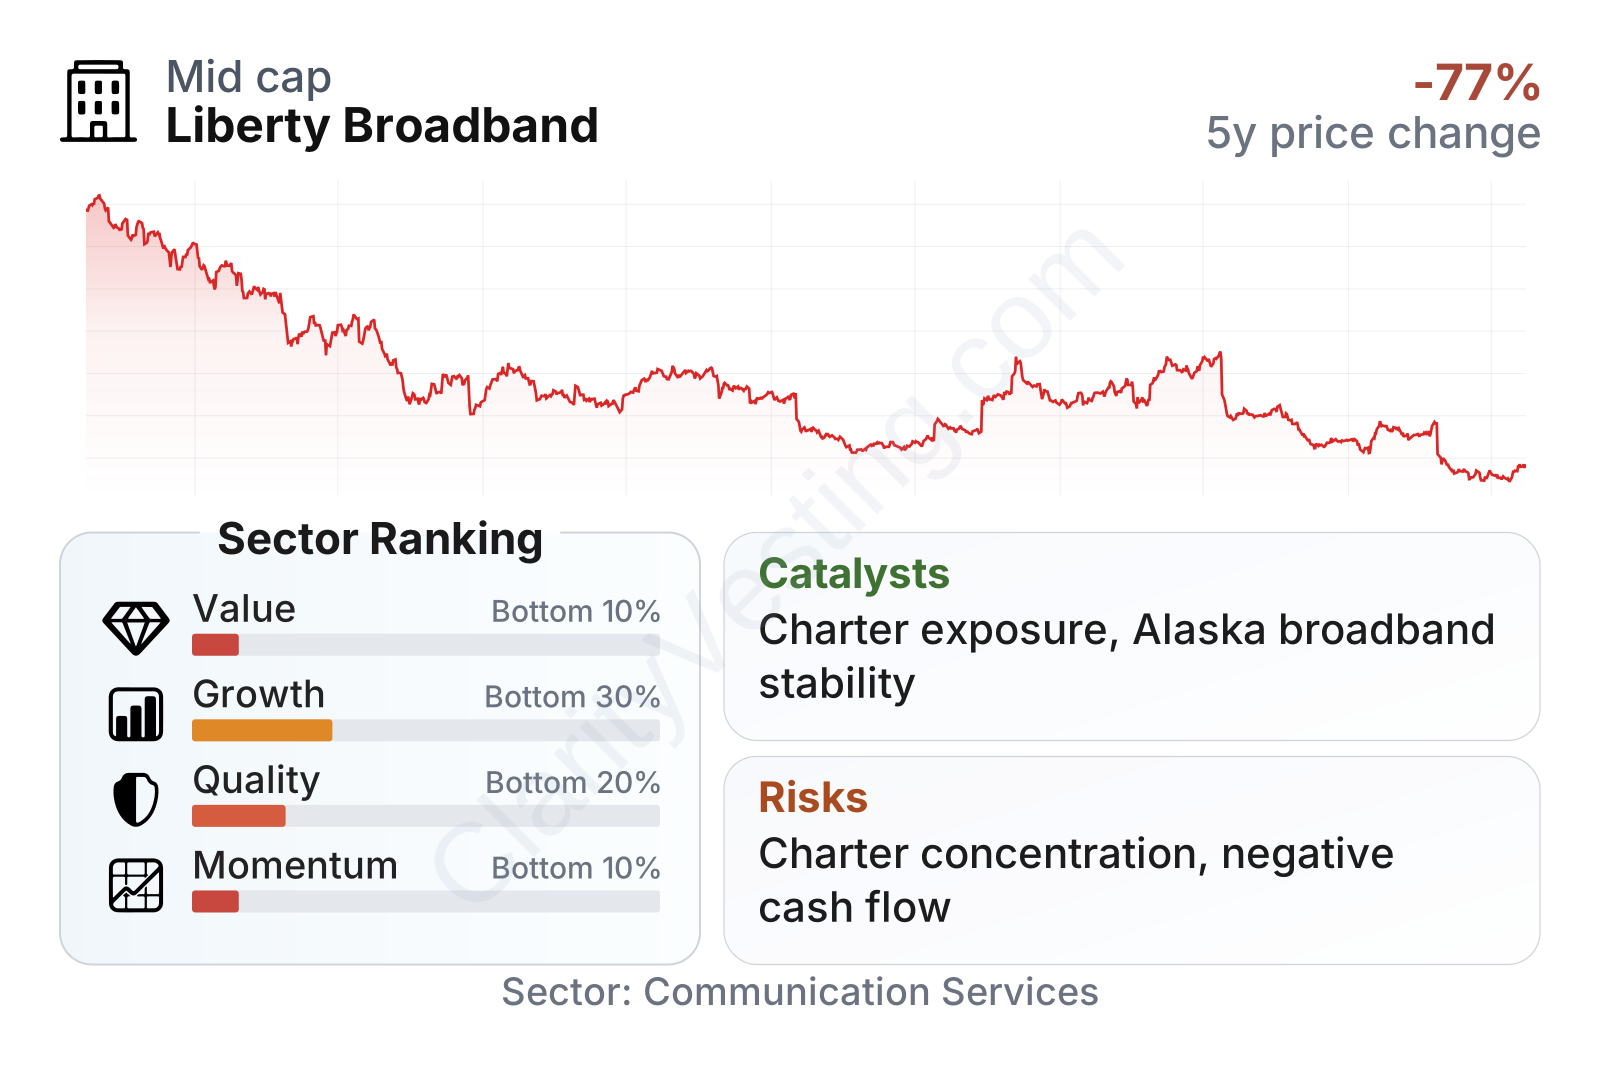
Liberty Broadband currently looks weak on most broad screening measures relative to the Communication Services sector. Value, growth, quality, and momentum all rank near the bottom of the sector, largely because recent earnings and cash flow have been distorted by losses and negative free cash flow. The company is still mid-sized in market value and its beta is below 1, which means the shares have historically moved less than the broader market, but that should not be confused with business simplicity.
The stock chart shows a long decline from 2021 levels, with the shares now far below their earlier peak. That weak market performance reflects both company-specific issues and the market’s changing view of cable, broadband growth, and Liberty Broadband’s structure.
Growth
Liberty Broadband operates in broadband and connectivity, which remains an important long-term sector. Households and businesses continue to depend on high-speed internet, mobile connectivity, and data usage. In that sense, the company is exposed to a durable market. The issue is that its growth profile is not especially broad-based, because most of the upside is tied to whether Charter can defend and expand its broadband position and whether GCI can remain resilient in Alaska.
For GCI, the strategy is relatively logical: maintain a strong local communications position in a geographically difficult market where infrastructure is hard to replicate. Remote and underserved areas can support durable demand for connectivity, and existing networks can create stickier customer relationships than in more crowded urban markets.
For the larger Charter exposure, the main long-term rationale is scale. Charter is one of the biggest cable broadband operators in the United States, and Liberty Broadband’s stake gives it indirect exposure to network economics, customer relationships, and the possibility of improved pricing, cost efficiency, and bundled service offerings over time.
Revenue growth has been modest rather than explosive. Recent year-over-year gains moved back into positive territory and reached the mid-single digits in the latest periods shown, which is a healthier pattern than the flat or slightly negative growth seen earlier. Still, the longer-term picture remains mixed, and that helps explain why growth metrics rank poorly versus the sector.
Free cash flow remains a weak point. The company has stayed negative on a trailing twelve-month basis for several years, although the losses narrowed meaningfully before worsening again in the latest reading. For a long-term equity case, sustained negative free cash flow makes the growth profile harder to rely on because it reduces financial flexibility and increases dependence on asset value rather than internally generated cash.
A notable catalyst is corporate simplification. Liberty Broadband has previously taken steps to reduce complexity, and any further moves involving asset structure, Charter ownership, or capital allocation could reshape how the market values the company. Another potential catalyst is operational stabilization at GCI, especially if broadband and wireless demand in Alaska remains firm. If Charter’s own operating performance improves meaningfully, that could also have an outsized effect on Liberty Broadband because of the company’s concentrated exposure.
Risks
This article is for informational purposes only and does not constitute financial advice. Some content is AI-generated. See Disclaimer


