Stock Analysis · KLA Corporation (KLAC)
Overview
KLA Corporation is a semiconductor equipment company focused on process control and yield management. In simple terms, it sells the tools and software chipmakers use to inspect wafers and masks, measure microscopic defects, and improve manufacturing quality. These steps are critical because modern chips are built with extremely small features, and even tiny errors can reduce output or lower performance. KLA is not the company making chips for consumers directly; it is one of the companies enabling major foundries, memory producers, and integrated device manufacturers to produce advanced semiconductors at high yields.
The business is organized around a mix of systems, recurring service, and related products. Based on the latest annual reporting structure, revenue is mainly generated from the following sources:
- Semiconductor Process Control: approximately 89% of revenue. This is KLA’s core business and includes inspection, metrology, and data analytics tools used in wafer and reticle manufacturing.
- Services: approximately 13% of revenue. This includes maintenance, spare parts, upgrades, and support tied to KLA’s installed base of equipment.
- PCB, Display and Component Inspection: approximately 7% of revenue. These products serve printed circuit boards, advanced packaging, displays, and electronic components.
Those percentages are approximate because company reporting categories can overlap across product lines and service attachments, but the main point is clear: KLA is overwhelmingly tied to semiconductor process control, with a meaningful recurring service stream supporting stability.
KLA’s financial profile also shows why the company is closely watched in this industry. Revenue has expanded materially over the last several years, while gross profit, operating income, and net income have all risen strongly. Research and development spending has also increased, which is important in a market where technical leadership can last only if product performance keeps improving.
The income flow highlights a business with strong pricing power and disciplined cost control. Revenue has moved from roughly $9 billion to nearly $14 billion over four years, while profitability has scaled up even faster. Research and development spending has grown in absolute dollars, yet margins have remained unusually strong for an equipment company.
Key Figures
| Metric | Value | Sector ⓘ |
|---|---|---|
| Date | Sep 12, 2026 | |
| Context | ||
| Sector | Technology | |
| Industry | Semiconductor Equipment & Materials | |
| Market Cap ⓘ | $236.01B | |
| Beta ⓘ | 1.44 | |
Value (Cheapness) | ||
| P/E Ratio ⓘ | 49.22 | 29.51 |
| FCF Yield ⓘ | 1.60% | 4.25% |
| EBIT / EV ⓘ | 2.43% | 2.85% |
| PEG ⓘ | 1.69 | |
Growth (Business expansion) | ||
| Revenue Growth ⓘ | 15.20% | 15.40% |
| RPS Growth (5Y CAGR) ⓘ | 14.07% | 8.56% |
| EPS Growth (5Y CAGR) ⓘ | 15.54% | -11.88% |
| Margin Growth (5Y Trend) ⓘ | 2.07% | 0.46% |
| FCF Growth (5Y CAGR) ⓘ | 5.81% | 9.80% |
Quality (Business durability) | ||
| ROIC (Latest) ⓘ | 42.22% | 9.44% |
| ROIC (5Y Median) ⓘ | 42.76% | 8.30% |
| Net Debt / EBIT (Latest) ⓘ | 0.80 | 0.54 |
| Net Debt / EBIT (5Y Median) ⓘ | 1.01 | 0.44 |
| Operating Margin (Latest) ⓘ | 41.69% | 9.58% |
| Operating Margin (5Y Median) ⓘ | 39.62% | 8.25% |
| Debt to Equity (Latest) ⓘ | 96.88% | 33.33% |
| Profit Margin (Latest) ⓘ | 35.57% | 7.14% |
| Free Cash Flow (Latest) ⓘ | $3.77B | |
Momentum (Price trend) | ||
| 3Y Return ⓘ | +280.80% | +45.48% |
| 12M Return (excl. last month) ⓘ | +124.04% | +23.48% |
| 6M Return ⓘ | +28.46% | +20.93% |
| Price vs. 200-Day MA ⓘ | +4.67% | +7.43% |
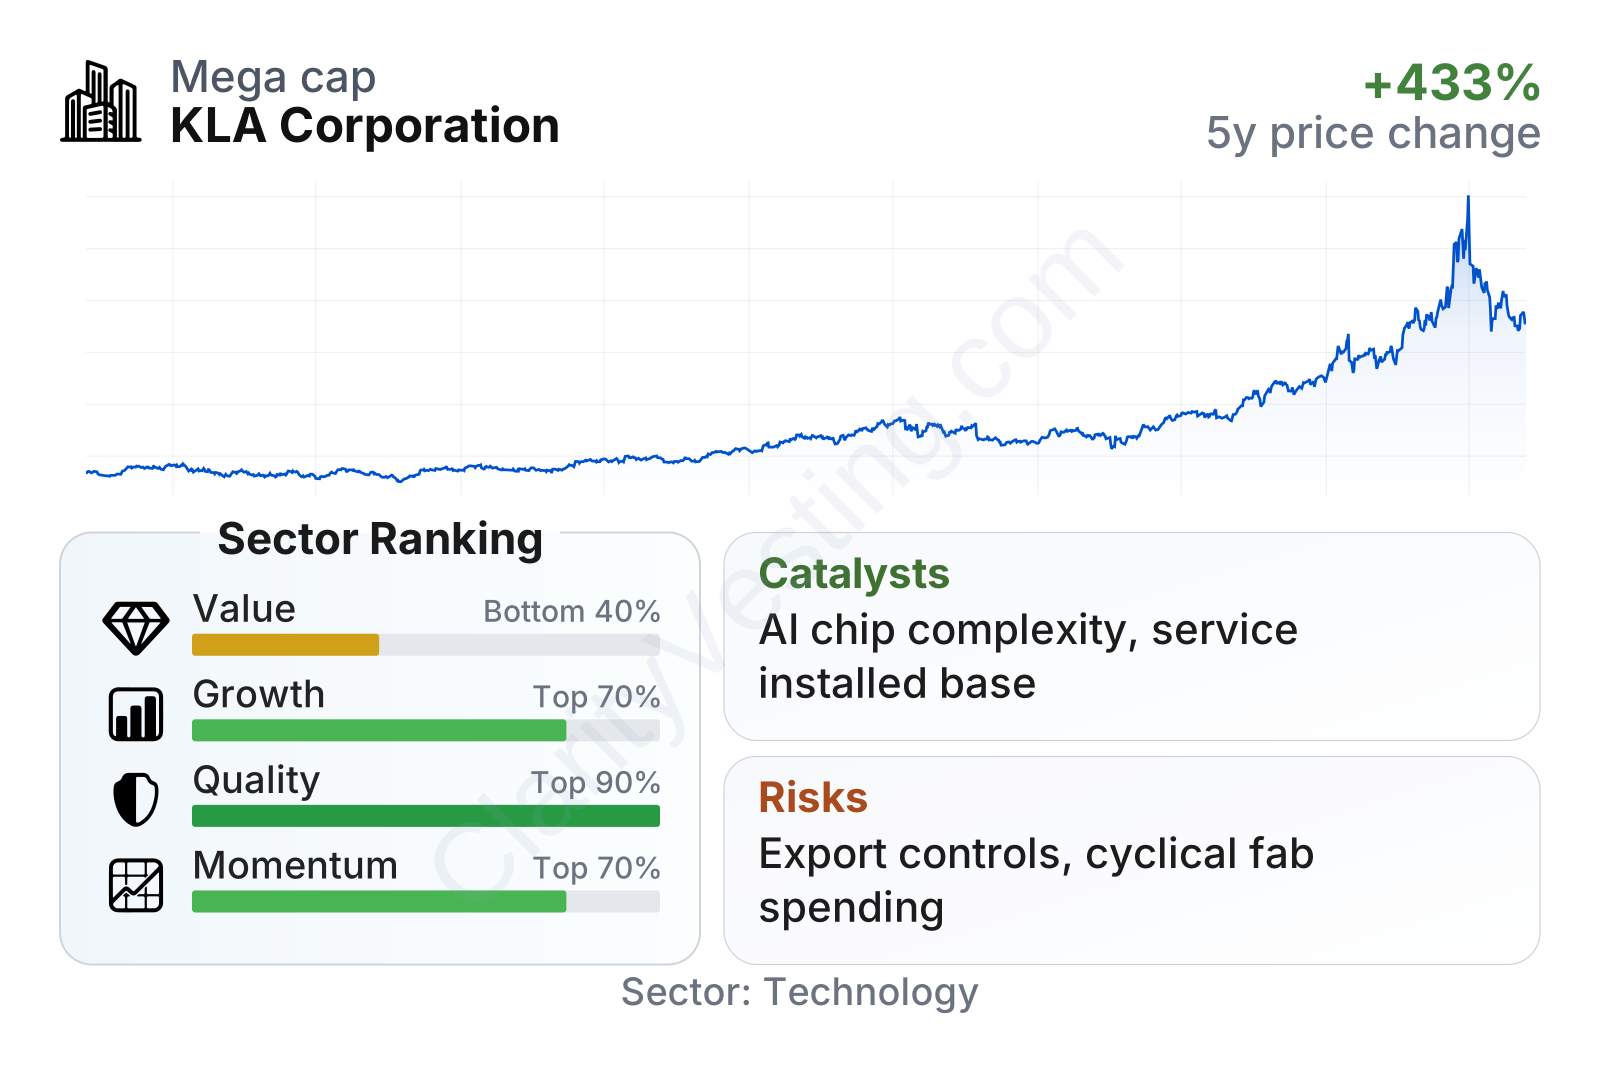
KLA stands out for business quality more than for cheap valuation. Profitability and returns on capital are far above most companies in its sector, while growth is solid rather than extreme. The weaker area is valuation, where the earnings multiple and cash flow yield suggest the market is already pricing in a lot of confidence. The company is also large and more volatile than the broad market, which is common in semiconductor-related names.
Growth
KLA operates in a sector with strong long-term expansion drivers. Semiconductor content continues to rise across data centers, artificial intelligence infrastructure, smartphones, autos, industrial systems, and advanced networking. As chips become more complex, manufacturers need tighter process control and more inspection steps. That directly supports demand for KLA’s tools because the cost of a production mistake rises sharply at advanced nodes.
The company’s strategy is aligned with that trend. KLA focuses on parts of semiconductor manufacturing where precision matters most and where switching suppliers is difficult. This creates a favorable setup: customers must keep investing to maintain yields, and installed tools create follow-on demand for service, parts, and upgrades. The service business is especially important because it adds recurring revenue on top of the more cyclical systems business.
Recent revenue growth shows the usual ups and downs of semiconductor capital spending, but the broader pattern is constructive. After a clear slowdown and contraction phase, growth recovered and has returned to the mid-teens range recently, slightly ahead of the sector median. Over a five-year view, revenue per share and earnings growth have also been strong, showing that KLA has not only grown, but done so efficiently.
Cash generation has also rebounded sharply after a temporary dip. Trailing free cash flow is back above $3.5 billion and has recently moved near the $4.0 billion level, which supports research spending, debt management, dividends, and buybacks. That matters for long-term analysis because it shows the company is not dependent on accounting profits alone; it is converting a large portion of its business strength into cash.
A major catalyst remains artificial intelligence-related chip demand. AI accelerators, high-bandwidth memory, and advanced packaging all increase manufacturing complexity, which tends to raise the need for inspection and metrology. KLA has also pointed to opportunities tied to leading-edge logic, memory recovery, packaging, and process control intensity per wafer. In practical terms, even if overall wafer volumes do not surge every year, spending per step can still increase because each chip generation is harder to manufacture well.
Risks
This article is for informational purposes only and does not constitute financial advice. Some content is AI-generated. See Disclaimer


