Stock Analysis · HP Inc (HPQ)
Overview
HP Inc. is a large personal computing and printing company. It sells laptops, desktops, workstations, monitors, printers, supplies such as ink and toner, and a growing set of commercial services and solutions around device management, security, workflow, and industrial graphics. The company serves both consumers and businesses, with corporate and public-sector customers playing an important role, especially in higher-value PCs, office printing, and managed print services.
HP’s business is organized into two main segments, and public filings make the revenue mix fairly clear. Based on the latest annual reporting, the company’s largest source of revenue is Personal Systems, while Printing remains smaller in sales but typically stronger in margin.
- Personal Systems: about 68% of revenue — notebooks, desktops, workstations, thin clients, retail point-of-sale systems, displays, software, support, and related services. This segment is tied to PC demand from businesses and consumers.
- Printing: about 32% of revenue — consumer and commercial printers, multifunction hardware, supplies such as ink and toner, industrial graphics, 3D printing solutions, and print-related services. Supplies are especially important because they usually generate recurring, higher-margin revenue after the hardware sale.
The broad pattern in recent years has been stable revenue around the mid-$50 billion range after a post-pandemic reset in PC demand. At the same time, profitability has become tighter than it was in 2021, which matters because HP operates in categories where pricing pressure and component costs can quickly affect margins.
Its cost structure also helps explain the business model. A very large share of sales is absorbed by product costs, leaving moderate gross profit that must cover selling expenses, research, debt costs, taxes, and shareholder returns. That means HP can still produce meaningful cash flow, but it does not have the naturally wide profit cushion seen in many software-heavy technology companies.
The long-term trend shows a business that remains very large in revenue but with lower operating and net income than its 2021 peak. Revenue has held up better than earnings, suggesting that margin pressure, mix shifts, and competitive pricing have mattered more than simple volume alone.
Key Figures
| Metric | Value | Sector ⓘ |
|---|---|---|
| Date | Sep 12, 2026 | |
| Context | ||
| Sector | Technology | |
| Industry | Computer Hardware | |
| Market Cap ⓘ | $29.52B | |
| Beta ⓘ | 1.21 | |
Value (Cheapness) | ||
| P/E Ratio ⓘ | 12.35 | 29.51 |
| FCF Yield ⓘ | 13.15% | 4.25% |
| EBIT / EV ⓘ | 8.90% | 2.85% |
| PEG ⓘ | 3.32 | |
Growth (Business expansion) | ||
| Revenue Growth ⓘ | 12.50% | 15.40% |
| RPS Growth (5Y CAGR) ⓘ | 2.77% | 8.56% |
| EPS Growth (5Y CAGR) ⓘ | -12.19% | -11.88% |
| Margin Growth (5Y Trend) ⓘ | -6.59% | 0.46% |
| FCF Growth (5Y CAGR) ⓘ | -16.74% | 9.80% |
Quality (Business durability) | ||
| ROIC (Latest) ⓘ | 32.97% | 9.44% |
| ROIC (5Y Median) ⓘ | 45.77% | 8.30% |
| Net Debt / EBIT (Latest) ⓘ | 1.94 | 0.54 |
| Net Debt / EBIT (5Y Median) ⓘ | 1.97 | 0.44 |
| Operating Margin (Latest) ⓘ | 5.35% | 9.58% |
| Operating Margin (5Y Median) ⓘ | 7.26% | 8.25% |
| Debt to Equity (Latest) ⓘ | -11238.04% | 33.33% |
| Profit Margin (Latest) ⓘ | 4.14% | 7.14% |
| Free Cash Flow (Latest) ⓘ | $3.88B | |
Momentum (Price trend) | ||
| 3Y Return ⓘ | +38.72% | +45.48% |
| 12M Return (excl. last month) ⓘ | +15.72% | +23.48% |
| 6M Return ⓘ | +91.35% | +20.93% |
| Price vs. 200-Day MA ⓘ | +57.40% | +7.43% |
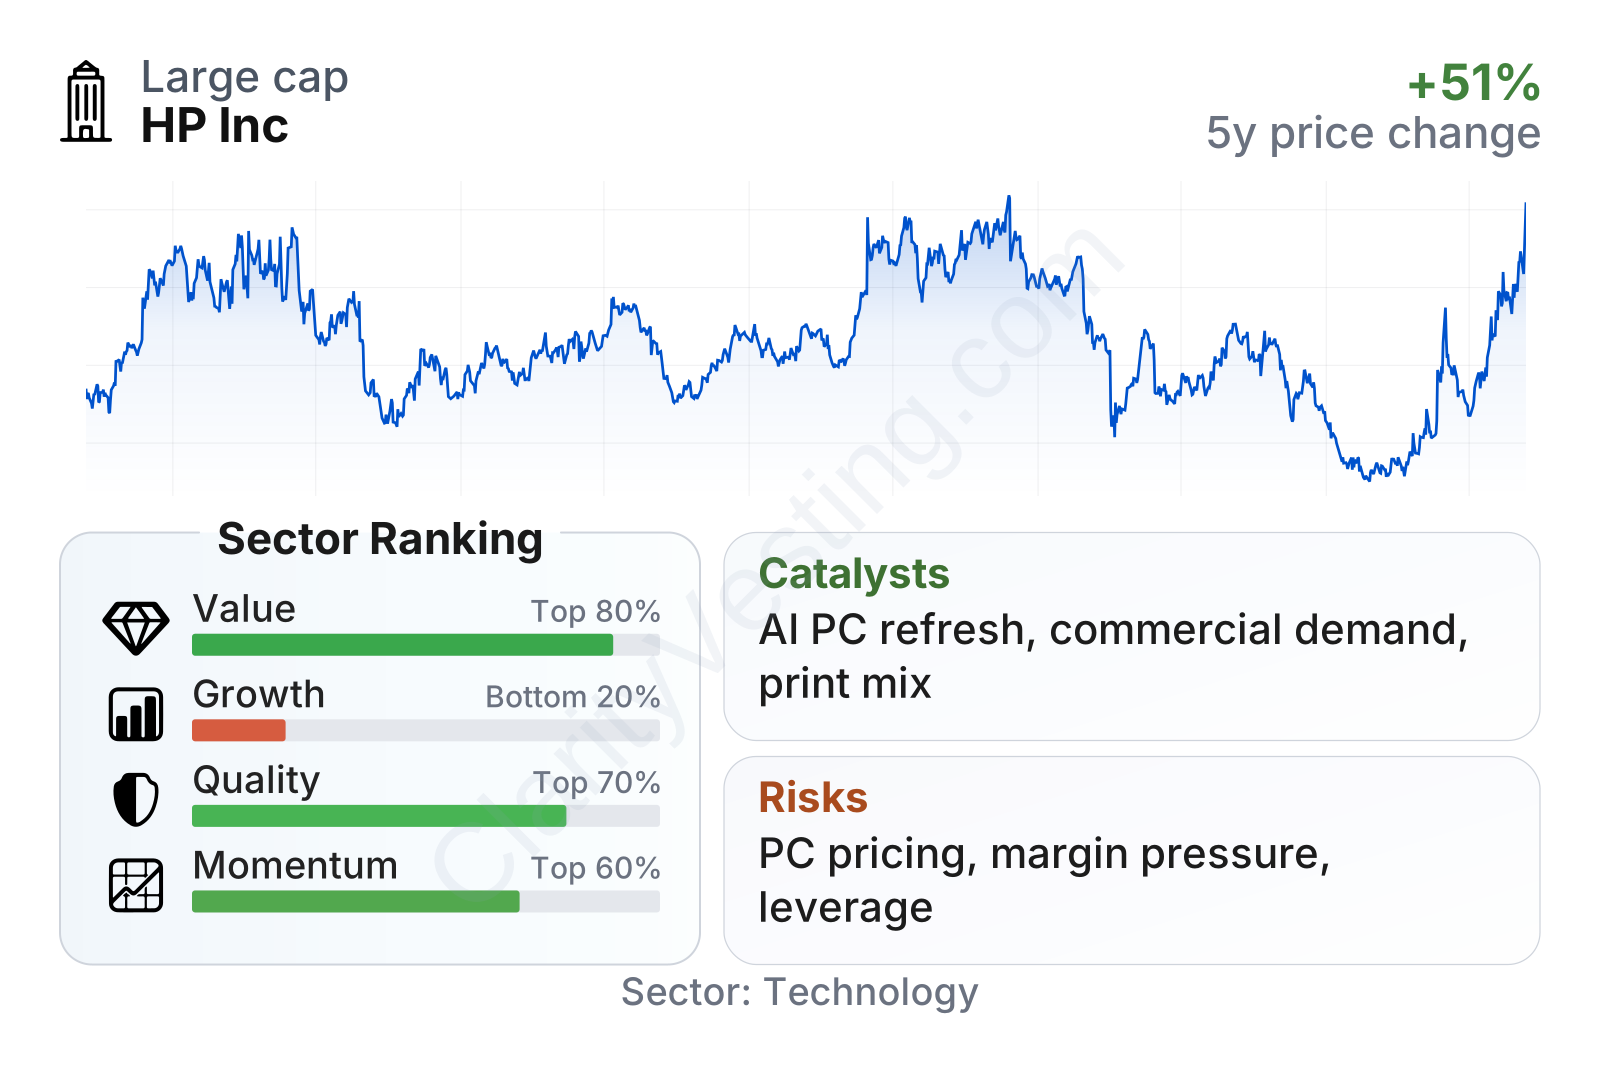
HP stands out as a large, established hardware company with mixed fundamentals. Valuation metrics look notably cheaper than the broader technology sector, and cash generation remains solid, with free cash flow yield and operating earnings relative to enterprise value well above sector medians. Quality is more nuanced: returns on invested capital are strong, but margins are below many technology peers and leverage is elevated. Growth is the weakest area, with multi-year trends in revenue per share, earnings, margins, and free cash flow trailing most of the sector. Share price momentum has improved recently, even though the longer three-year return still lags the broader technology group.
Growth
HP operates in mature markets rather than in a fast-expanding corner of technology. The global PC market and traditional printing market are not structurally high-growth categories on their own. For long-term analysis, that means the central question is less about rapid industry expansion and more about whether HP can gain share, improve mix, and attach more services, subscriptions, and higher-value products to its installed base.
That said, there are still credible growth paths. In PCs, the commercial refresh cycle remains important as businesses replace aging fleets and increasingly demand AI-capable devices, stronger security, and better fleet management. HP has been positioning itself around premium notebooks, workstations, hybrid-work devices, and enterprise services. In printing, the strategy centers on defending the supplies business, expanding subscription and contract-based relationships, and pushing into industrial and digital workflow categories where the economics can be better than in consumer hardware alone.
Recent performance suggests the business has moved out of the sharp downturn seen in 2022 and 2023. Revenue growth turned negative for several quarters during the post-pandemic correction, but the trend has gradually improved and has become positive again, reaching low-double-digit year-over-year growth most recently. Even so, the company’s growth profile still ranks near the lower end of the technology sector, which shows that the recovery is real but not enough on its own to make HP a high-growth company.
Cash generation remains one of the more constructive elements. Free cash flow has stayed positive through the cycle, although it is below earlier peaks and has been uneven over the last several years. A business with moderate growth can still create long-term value if it consistently turns revenue into cash, and HP has historically been able to do that better than many hardware peers.
On strategy, HP has also continued to emphasize cost discipline, portfolio mix, and shareholder returns, while investing in AI PCs, commercial systems, security offerings, and print subscriptions. The main catalyst here is not a single breakthrough product but the combination of a corporate PC refresh cycle, local AI features on new devices, and stabilization in print and supplies demand. Public company updates in 2026 have continued to point to AI PC launches and commercial demand as areas of focus, which could support a better revenue mix if adoption expands.
Risks
This article is for informational purposes only and does not constitute financial advice. Some content is AI-generated. See Disclaimer


