Stock Analysis · Hyatt Hotels Corporation (H)
Overview
Hyatt Hotels Corporation is a global hospitality company best known for its hotel brands, resorts, and luxury properties. It operates through a mix of owned and leased hotels, management contracts, franchise agreements, and lifestyle-focused hospitality offerings. In simple terms, Hyatt makes money both from running hotels directly and from collecting fees from property owners who use Hyatt brands and operating systems.
Its portfolio spans luxury, upper-upscale, upscale, lifestyle, all-inclusive, and wellness-oriented properties. Over time, Hyatt has been shifting more of its business toward fee-based and asset-light activities, which generally require less capital than owning real estate directly. That matters for long-term analysis because fee income is often more scalable and less exposed to property-level volatility than a heavily owned-hotel model.
Based on recent company reporting, Hyatt’s revenue mix is broadly driven by the following sources:
- Owned and leased hotels: approximately 55% to 65% of revenue in recent periods. This includes room revenue, food and beverage, and other on-property spending from hotels Hyatt owns or leases.
- Management and franchise fees: approximately 15% to 25% of revenue. These fees come from third-party hotel owners paying Hyatt to manage properties or use its brands, reservation system, and loyalty platform.
- All-inclusive, distribution, and other services: approximately 15% to 25% of revenue, depending on period and deal activity. This includes results tied to all-inclusive operations, travel and distribution services, and other hospitality-related income streams.
That mix can move meaningfully from one year to another because Hyatt has been actively buying, selling, and repositioning assets. The overall direction, however, is clear: the company is trying to increase earnings from branded management, franchising, and lifestyle platforms rather than relying only on hotel ownership.
At a high level, the business has become much larger since the pandemic recovery, but the path has not been smooth. Revenue rose sharply from 2021 to 2023, stayed around similar levels in 2024, and then became harder to read in 2025 because acquisitions and business mix changes appear to have distorted the comparison. The most important takeaway is that Hyatt today is not the same company it was a few years ago: it is broader, more brand-driven, and more focused on fee-generating growth.
The long-term trend shown here is a recovery from pandemic-era losses into positive operating income, but with net income swinging more sharply than operating profit. That usually signals that one-time items, financing costs, taxes, and portfolio changes have had a meaningful impact on reported earnings, so underlying business quality matters more than headline profit alone.
Key Figures
| Metric | Value | Sector ⓘ |
|---|---|---|
| Date | Sep 12, 2026 | |
| Context | ||
| Sector | Consumer Cyclical | |
| Industry | Lodging | |
| Market Cap ⓘ | $15.21B | |
| Beta ⓘ | 1.34 | |
Value (Cheapness) | ||
| P/E Ratio ⓘ | 196.82 | 17.10 |
| FCF Yield ⓘ | 2.58% | 8.53% |
| EBIT / EV ⓘ | 2.85% | 6.46% |
| PEG ⓘ | 0.79 | |
Growth (Business expansion) | ||
| Revenue Growth ⓘ | -6.60% | 5.75% |
| RPS Growth (5Y CAGR) ⓘ | 52.35% | 9.14% |
| EPS Growth (5Y CAGR) ⓘ | -16.74% | -18.21% |
| Margin Growth (5Y Trend) ⓘ | 22.89% | -0.23% |
| FCF Growth (5Y CAGR) ⓘ | -6.04% | 4.91% |
Quality (Business durability) | ||
| ROIC (Latest) ⓘ | 0.80% | 12.61% |
| ROIC (5Y Median) ⓘ | 4.95% | 10.72% |
| Net Debt / EBIT (Latest) ⓘ | 7.40 | 2.10 |
| Net Debt / EBIT (5Y Median) ⓘ | 7.42 | 2.32 |
| Operating Margin (Latest) ⓘ | 8.58% | 9.25% |
| Operating Margin (5Y Median) ⓘ | 9.17% | 9.64% |
| Debt to Equity (Latest) ⓘ | 136.39% | 75.78% |
| Profit Margin (Latest) ⓘ | 2.33% | 5.33% |
| Free Cash Flow (Latest) ⓘ | $392.00M | |
Momentum (Price trend) | ||
| 3Y Return ⓘ | +52.19% | +14.53% |
| 12M Return (excl. last month) ⓘ | +27.26% | +3.08% |
| 6M Return ⓘ | +13.79% | +0.55% |
| Price vs. 200-Day MA ⓘ | -3.64% | -0.54% |
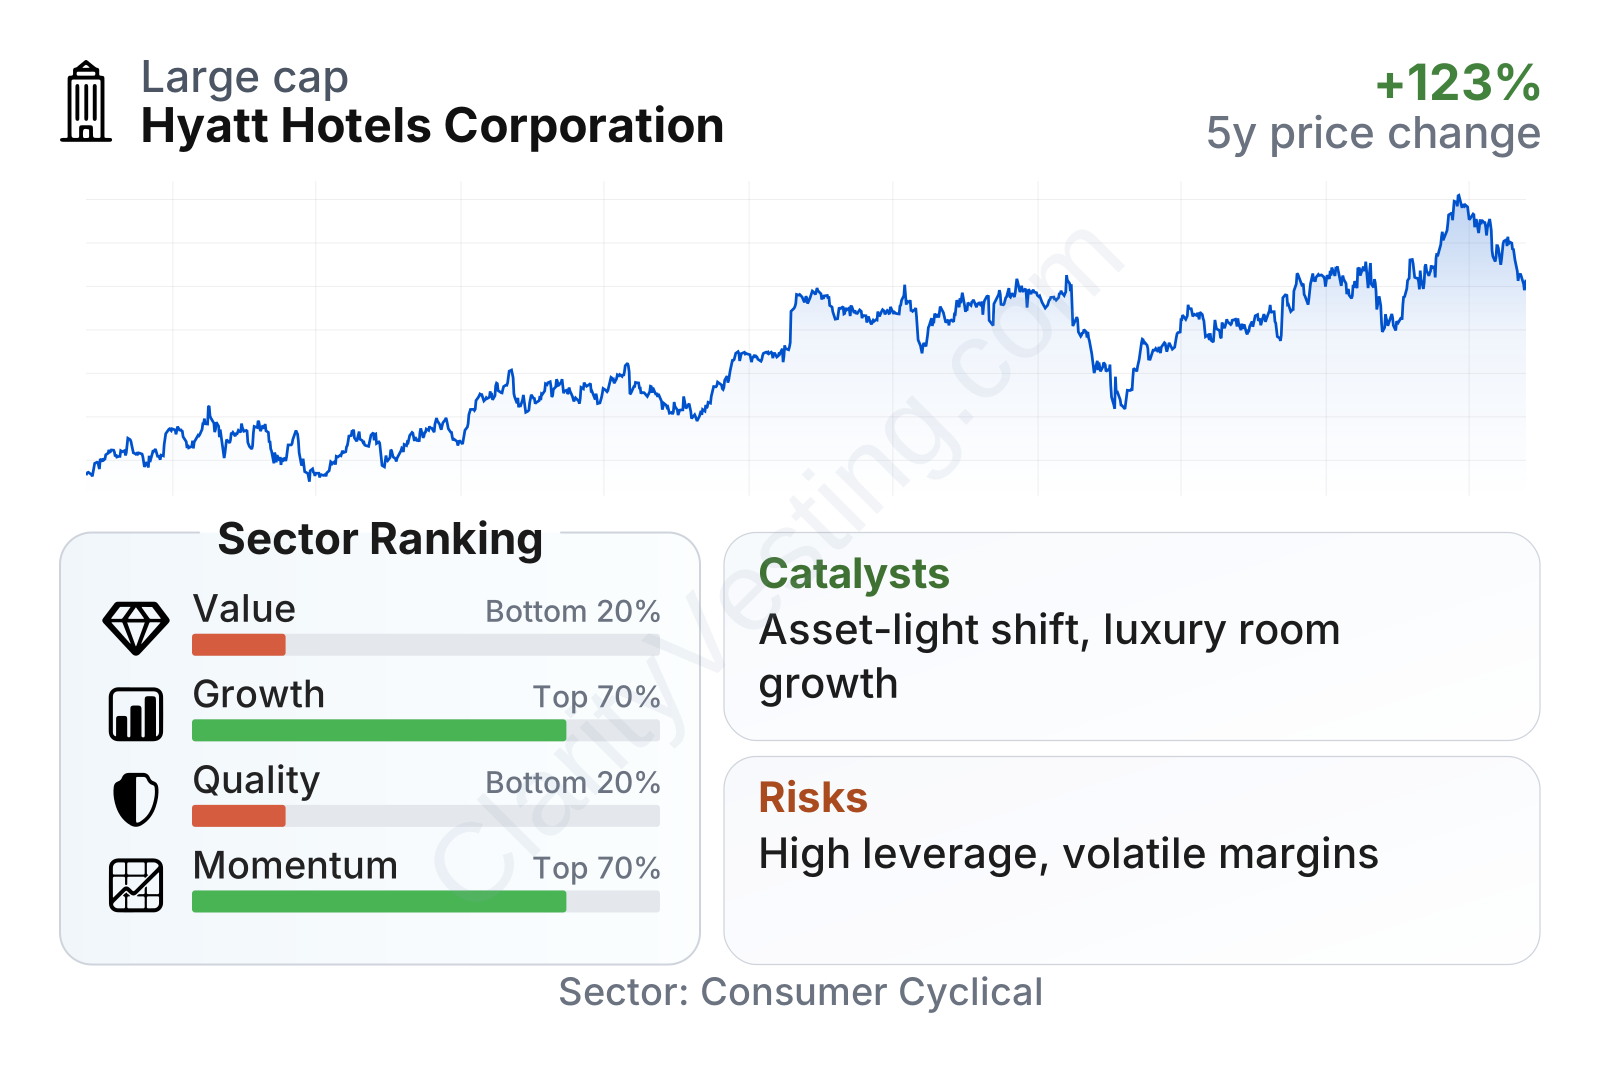
Hyatt is a mid-to-large player in lodging, and its share price has performed well over the last three years, clearly ahead of the broader sector median. That strong market performance contrasts with a weaker current value profile: the company ranks in the bottom fifth of its sector on valuation metrics, with a very high trailing P/E and a free cash flow yield well below the sector median. Growth indicators are mixed, with very strong five-year revenue-per-share expansion and improving operating margins, but weaker recent revenue growth and softer cash generation. Quality is also mixed: operating margins are above the sector median, yet leverage is elevated and returns on invested capital remain below many peers.
Growth
The lodging sector is structurally supported by several long-term drivers: rising global travel demand, continued expansion of branded hotel networks, loyalty-driven booking ecosystems, and growing interest in higher-end and experience-led travel. Hyatt is especially exposed to segments that have remained attractive over time, including luxury, lifestyle, resorts, and all-inclusive destinations. Those areas typically benefit from stronger pricing power than more commoditized hotel categories.
Hyatt’s strategy also makes sense in that context. Management has emphasized brand expansion, loyalty ecosystem growth, and a more asset-light model. That combination can be powerful if executed well: management and franchise fees tend to grow with room additions and pricing, while requiring far less capital than building or owning more hotels directly. The company has also been building scale in lifestyle and all-inclusive hospitality, two categories that can deepen customer engagement and differentiate Hyatt from more conventional hotel operators.
Recent growth has been uneven. After the powerful post-pandemic rebound, year-over-year comparisons became more volatile, and the latest annual revenue growth rate sits modestly below zero in the summary metrics. Even so, the longer-term picture is stronger than that single number suggests. Five-year revenue per share growth has been far ahead of the sector median, which indicates Hyatt has materially expanded its business base despite short-term fluctuations.
Cash generation deserves close attention. Free cash flow improved meaningfully through 2024, then weakened sharply over the following year. That does not automatically mean the business model is deteriorating, because acquisitions, integration spending, working capital movements, and property transactions can heavily affect cash flow in hospitality. Still, for a long-term view, Hyatt would look stronger if cash conversion becomes more consistent as the portfolio shift matures.
A major catalyst is Hyatt’s continued move toward higher-fee, brand-led earnings streams. Another is unit growth: each additional hotel under management or franchise can expand fee revenue without requiring Hyatt to carry all the property ownership risk. The company’s concentration in luxury, upper-upscale, resorts, and all-inclusive categories may also provide a tailwind if travel demand remains resilient in premium segments. Recent portfolio actions and brand expansion efforts suggest Hyatt is still reshaping itself around those opportunities rather than simply waiting for cyclical demand to do the work.
Risks
This article is for informational purposes only and does not constitute financial advice. Some content is AI-generated. See Disclaimer


