Stock Analysis · Green Brick Partners Inc (GRBK)
Overview
Green Brick Partners is a U.S. homebuilder and land developer focused mainly on faster-growing markets in Texas, Georgia, and Florida. The company builds and sells single-family homes through a group of local brands, develops lots for those homes, and earns additional income from related activities such as mortgage services. Its business is tied closely to housing demand, affordability, and the availability of finished lots in attractive submarkets.
The company’s revenue is heavily concentrated in home closings, with smaller contributions from land and financial services. Based on recent annual reporting, the mix is approximately:
- Homebuilding revenue: about 96% to 98% — sales of completed homes and homes built under contract across its builder brands.
- Land and lot sales: about 1% to 3% — sales of finished lots or land positions, sometimes to third parties or partners.
- Financial services and other: about 1% to 2% — mainly mortgage-related operations and smaller ancillary items tied to the home sale process.
What stands out in Green Brick’s model is that it combines homebuilding with a meaningful land pipeline. That can help protect future community openings and lot availability, which is important in markets where developable land is limited.
Over the last several years, revenue and profit expanded materially, especially through 2024, before easing in 2025. Even with that pullback, the business still converts a relatively large share of sales into operating income compared with many companies in the broader consumer cyclical group.
Key Figures
| Metric | Value | Sector ⓘ |
|---|---|---|
| Date | Sep 12, 2026 | |
| Context | ||
| Sector | Consumer Cyclical | |
| Industry | Residential Construction | |
| Market Cap ⓘ | $2.90B | |
| Beta ⓘ | 1.80 | |
Value (Cheapness) | ||
| P/E Ratio ⓘ | 10.37 | 17.10 |
| FCF Yield ⓘ | 3.74% | 8.53% |
| EBIT / EV ⓘ | 12.74% | 6.46% |
| PEG ⓘ | 1.15 | |
Growth (Business expansion) | ||
| Revenue Growth ⓘ | -8.70% | 5.75% |
| RPS Growth (5Y CAGR) ⓘ | 14.02% | 9.14% |
| EPS Growth (5Y CAGR) ⓘ | -17.41% | -18.21% |
| Margin Growth (5Y Trend) ⓘ | 5.24% | -0.23% |
| FCF Growth (5Y CAGR) ⓘ | N/A | 4.91% |
Quality (Business durability) | ||
| ROIC (Latest) ⓘ | 14.68% | 12.61% |
| ROIC (5Y Median) ⓘ | 20.57% | 10.72% |
| Net Debt / EBIT (Latest) ⓘ | 0.45 | 2.10 |
| Net Debt / EBIT (5Y Median) ⓘ | 0.40 | 2.32 |
| Operating Margin (Latest) ⓘ | 20.66% | 9.25% |
| Operating Margin (5Y Median) ⓘ | 22.01% | 9.64% |
| Debt to Equity (Latest) ⓘ | 15.91% | 75.78% |
| Profit Margin (Latest) ⓘ | 14.79% | 5.33% |
| Free Cash Flow (Latest) ⓘ | $108.45M | |
Momentum (Price trend) | ||
| 3Y Return ⓘ | +52.55% | +14.53% |
| 12M Return (excl. last month) ⓘ | +4.44% | +3.08% |
| 6M Return ⓘ | +6.81% | +0.55% |
| Price vs. 200-Day MA ⓘ | -1.91% | -0.54% |
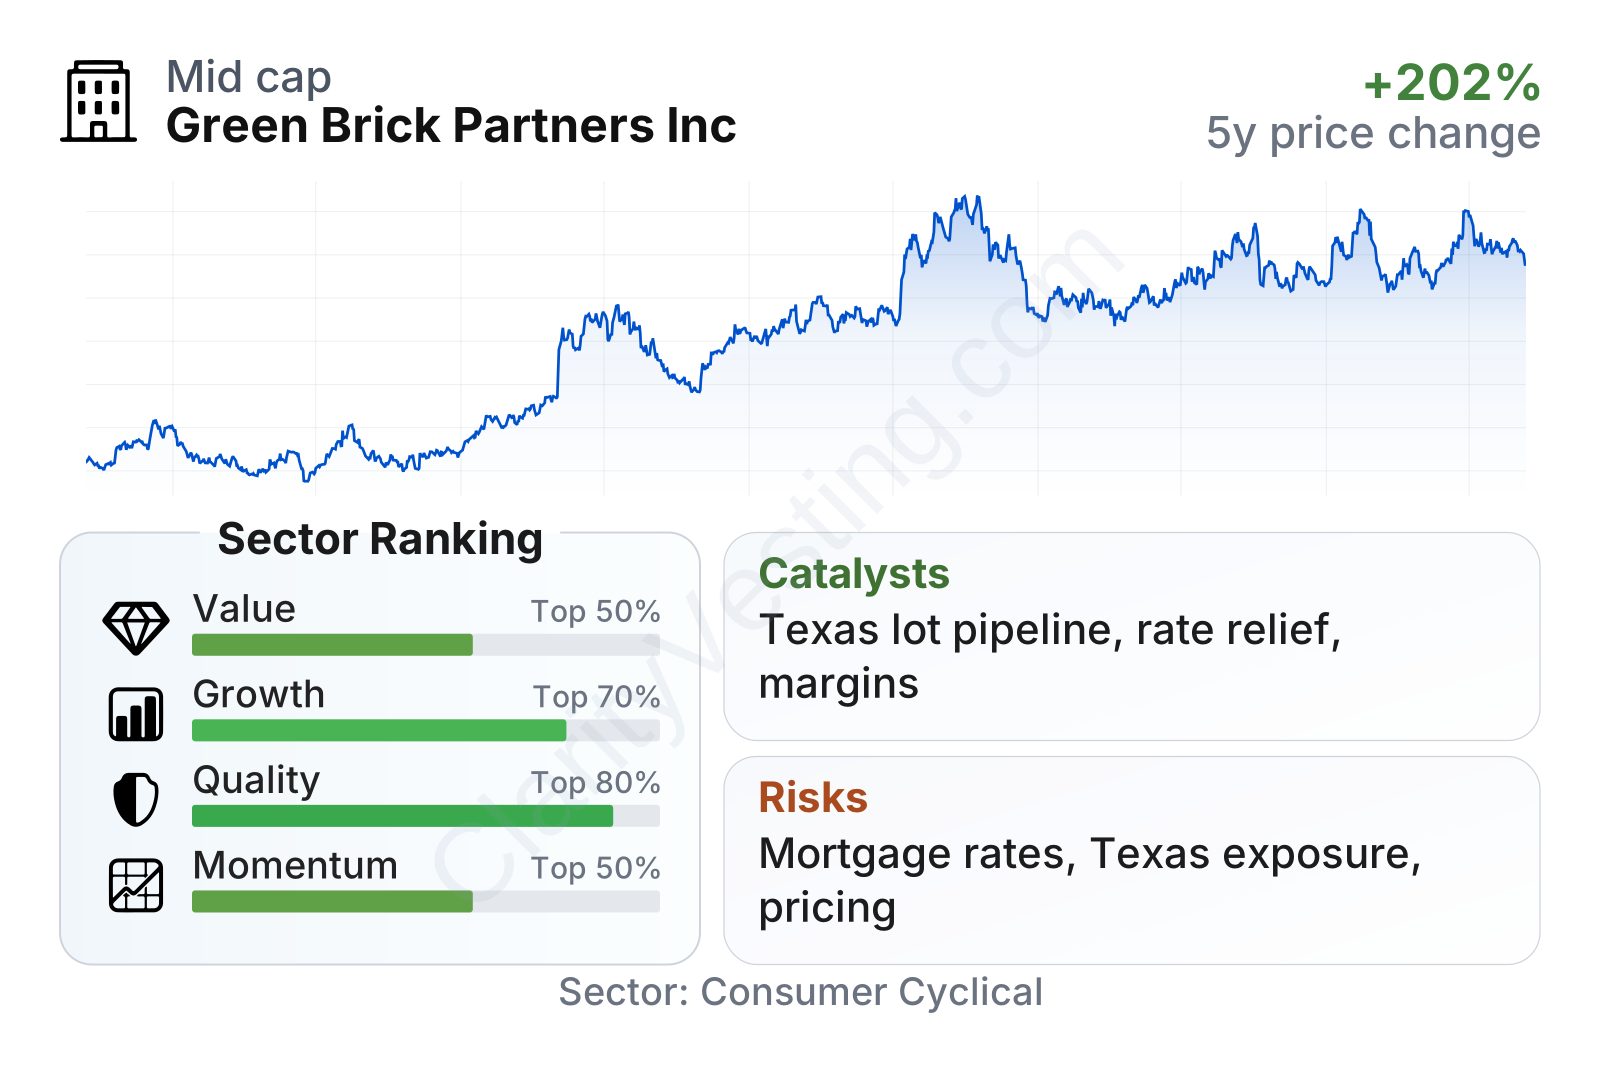
Green Brick is a mid-sized public homebuilder with a stock that has been more volatile than the broader market, which is common for housing-related companies. The overall profile is mixed in a useful way: valuation looks below sector norms on earnings, quality metrics are notably strong, and growth has cooled recently after a very strong multi-year run. Profitability, return on invested capital, and balance-sheet leverage all compare favorably with the sector, which gives the company a sturdier financial base than many peers.
Growth
Residential construction remains a structurally important sector because the U.S. still faces housing supply constraints in many markets. That does not mean growth is smooth every year, but it does create a backdrop where well-positioned builders can keep expanding over time. Green Brick is concentrated in Sun Belt markets that have benefited from population growth, job creation, and continued housing demand, especially in parts of Texas and the Southeast.
The company’s strategy appears coherent for long-term expansion. Rather than chasing scale everywhere, Green Brick has stayed focused on selected local markets and on controlling its lot pipeline. That matters because access to well-located land often determines who can grow efficiently in homebuilding. Its past five-year revenue-per-share growth of roughly 14% is ahead of the sector median, suggesting that the company has added business volume without relying only on financial engineering.
Nearer term, growth has clearly slowed. Year-over-year revenue has turned negative in recent quarters after stronger periods in 2024, showing that the housing cycle is no longer as favorable as it was when demand and pricing were surging. For a cyclical business, this is an important distinction: long-term market positioning can remain attractive even while short-term comparisons weaken.
Cash generation has also been uneven, which is normal in homebuilding because land acquisition, development timing, and inventory swings can move cash flow sharply from one period to another. Even so, trailing free cash flow is positive and has improved from weaker periods. That suggests the business is still producing cash while funding growth, rather than depending heavily on outside financing.
Recent company updates have continued to emphasize community growth, lot supply, and operational discipline. If mortgage rates stabilize or decline from elevated levels, that could improve affordability and support orders. Another potential catalyst is the company’s ability to keep opening new communities in land-constrained submarkets where pricing has held up better than national averages.
Risks
This article is for informational purposes only and does not constitute financial advice. Some content is AI-generated. See Disclaimer


