Stock Analysis · Grab Holdings Ltd (GRAB)
Overview
Grab Holdings Ltd operates a large everyday-services platform in Southeast Asia. Through one app, users can book rides, order food and groceries, send parcels, pay merchants, use digital wallets, and access lending or insurance-related financial services. The company is active across multiple countries in the region, including Indonesia, Malaysia, Singapore, Thailand, Vietnam, and the Philippines, which gives it exposure to a fast-growing digital consumer market.
Its business is built around three main reporting segments. Based on the latest annual filing, revenue comes primarily from mobility and delivery, with financial services still smaller but strategically important because it can deepen customer engagement and raise spending per user over time.
- Deliveries: about 50% of revenue. This includes food delivery, grocery delivery, and parcel-related services booked through the platform.
- Mobility: about 30% of revenue. This covers ride-hailing services such as on-demand transport for passengers.
- Financial Services: about 15% of revenue. This includes digital payments, lending, and selected financial products offered to consumers and merchants.
- Enterprise and New Initiatives: about 5% of revenue. This generally includes advertising, software tools, and other emerging services for business customers.
What makes Grab different from a pure ride-hailing company is the way these services reinforce each other. A user who takes rides may also order meals, use the wallet, and borrow through the same ecosystem. A merchant that accepts Grab payments may also advertise on Grab and use delivery logistics. That interconnected model is a central part of the long-term thesis.
Operating trends have improved sharply over the last few years. Revenue has expanded from well under $1 billion in 2021 to more than $3 billion in 2025, while gross profit and operating income have moved in the right direction. The company has also reduced interest expense substantially from post-listing levels, which has made the income statement cleaner and easier to evaluate.
The long-term pattern shows a business that has scaled meaningfully: revenue and gross profit have risen strongly, selling costs have become more controlled, and Grab moved from heavy losses to positive net income in 2025. That does not remove execution risk, but it does show that the platform is becoming more economically efficient as it grows.
Key Figures
| Metric | Value | Sector ⓘ |
|---|---|---|
| Date | Sep 12, 2026 | |
| Context | ||
| Sector | Technology | |
| Industry | Software - Application | |
| Market Cap ⓘ | $12.31B | |
| Beta ⓘ | 0.89 | |
Value (Cheapness) | ||
| P/E Ratio ⓘ | 27.36 | 29.51 |
| FCF Yield ⓘ | -0.54% | 4.25% |
| EBIT / EV ⓘ | 7.72% | 2.85% |
| PEG ⓘ | 0.63 | |
Growth (Business expansion) | ||
| Revenue Growth ⓘ | 21.90% | 15.40% |
| RPS Growth (5Y CAGR) ⓘ | 45.17% | 8.56% |
| EPS Growth (5Y CAGR) ⓘ | N/A | -11.88% |
| Margin Growth (5Y Trend) ⓘ | N/A | 0.46% |
| FCF Growth (5Y CAGR) ⓘ | N/A | 9.80% |
Quality (Business durability) | ||
| ROIC (Latest) ⓘ | 7.28% | 9.44% |
| ROIC (5Y Median) ⓘ | -3.80% | 8.30% |
| Net Debt / EBIT (Latest) ⓘ | -1.31 | 0.54 |
| Net Debt / EBIT (5Y Median) ⓘ | N/A | 0.44 |
| Operating Margin (Latest) ⓘ | 16.91% | 9.58% |
| Operating Margin (5Y Median) ⓘ | -15.56% | 8.25% |
| Debt to Equity (Latest) ⓘ | 30.05% | 33.33% |
| Profit Margin (Latest) ⓘ | 16.03% | 7.14% |
| Free Cash Flow (Latest) ⓘ | -$67.00M | |
Momentum (Price trend) | ||
| 3Y Return ⓘ | -19.53% | +45.48% |
| 12M Return (excl. last month) ⓘ | -27.66% | +23.48% |
| 6M Return ⓘ | -18.67% | +20.93% |
| Price vs. 200-Day MA ⓘ | -23.80% | +7.43% |
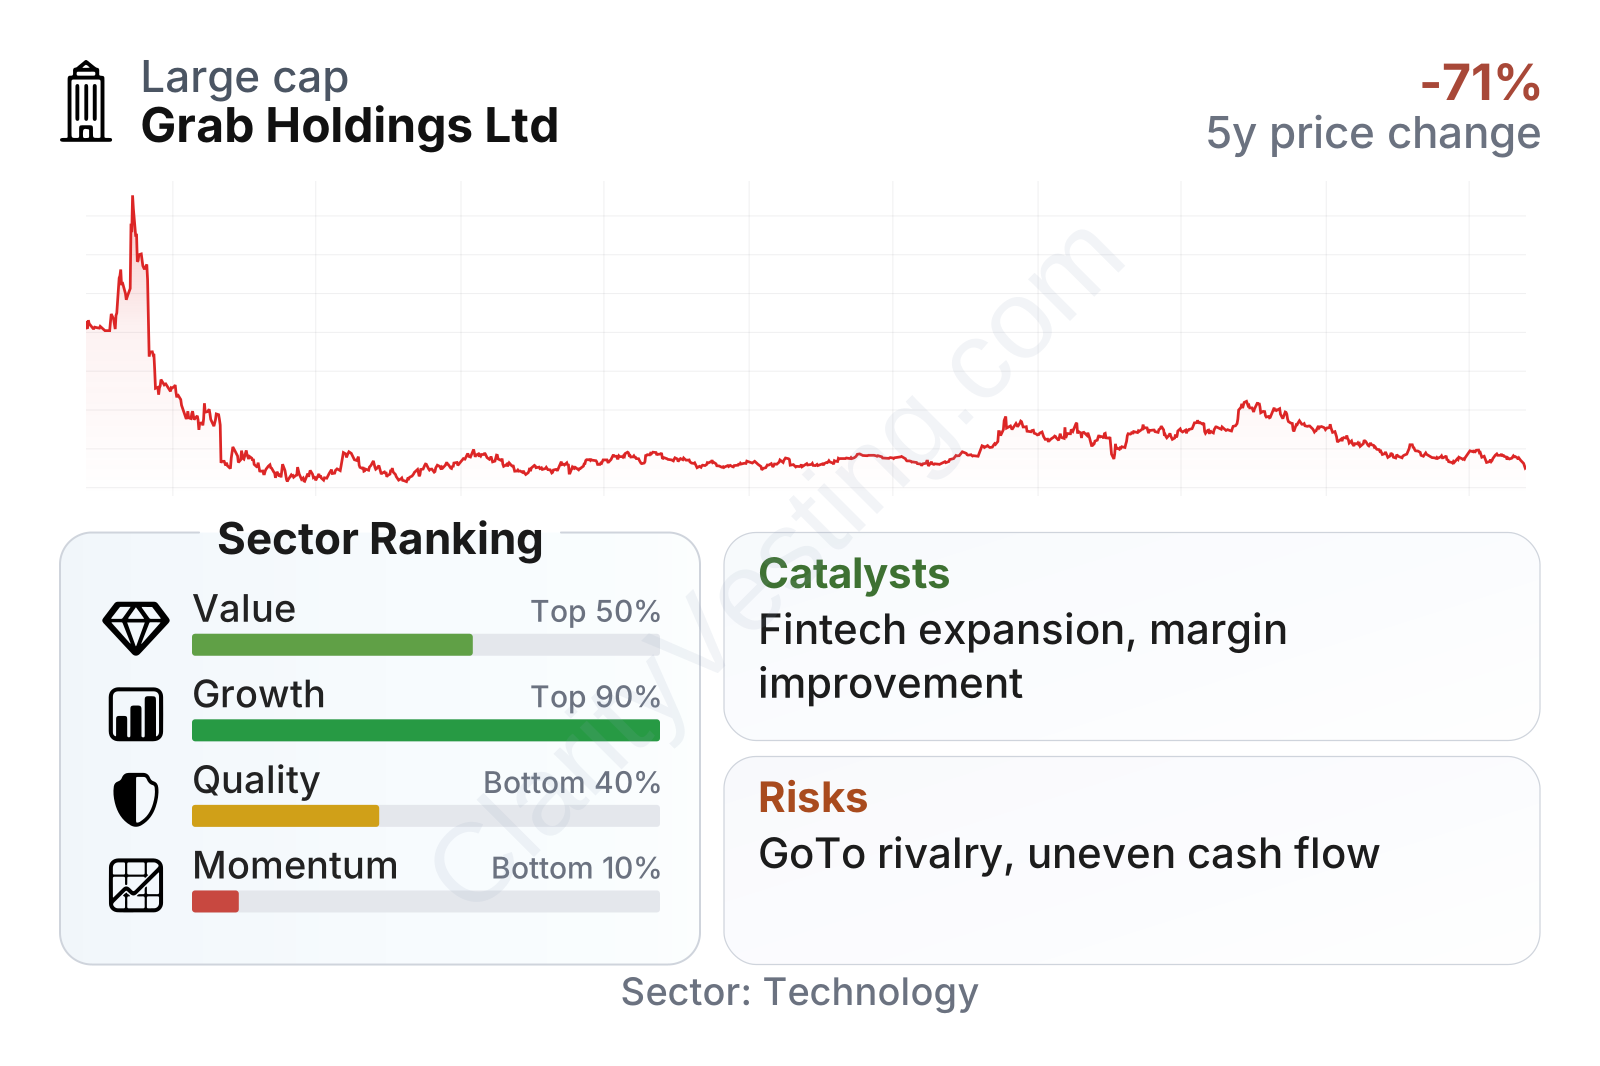
Grab sits in the large-cap range for its niche, with share-price volatility below the broader market by beta. The table points to a mixed profile: growth ranks near the top of the sector, while quality and momentum remain weaker. Profitability metrics have improved a lot, but returns on invested capital are still below many software peers, which suggests the turnaround is real yet still incomplete.
The stock’s history also shows why the market remains cautious. After a steep decline following its public listing, the shares recovered for a period but have recently weakened again. That combination of strong business improvement and soft market momentum often means investors are waiting for more proof that profits and cash generation can remain durable.
Growth
Grab operates in a sector with favorable structural tailwinds. Southeast Asia continues to digitize consumer spending, transportation, food ordering, merchant payments, and small-business financial services. In markets where smartphone adoption and digital payments are still expanding, a platform with strong local reach can keep adding users, merchants, and transaction volume even without entering entirely new countries.
The company’s strategy for future growth is coherent. Rather than relying on one service, Grab is trying to increase how often users interact with the app and how many services they use. That matters because cross-selling can improve economics: customer acquisition costs can be spread across rides, deliveries, payments, and financial products instead of being attached to a single transaction stream.
Recent revenue growth has cooled from the extraordinary rebound period after pandemic disruptions, but it still remains strong at a little above 20% year over year, clearly ahead of the sector median. More importantly, the trend has been relatively steady over the last several quarters rather than collapsing after the initial recovery, which suggests demand is holding up across core services.
Another important growth signal is the scale of the company’s five-year expansion. Revenue per share growth has been far stronger than the sector median, showing that Grab is not simply treading water in a competitive market. It has been building a larger business while also improving operating margins from deeply negative levels to solidly positive territory on a trailing basis.
Cash generation has been less smooth than earnings. Free cash flow turned positive in 2024 and surged in 2025 before slipping back into a small trailing twelve-month deficit more recently. That does not erase the broader progress, but it does show that Grab is still in a transition phase where working capital movements, investment needs, and credit-related fluctuations can materially affect cash results from quarter to quarter.
A key catalyst is the build-out of financial services. Payments and lending are still a smaller part of revenue, yet they can become disproportionately important if management expands monetization without taking excessive credit risk. Another catalyst is enterprise monetization, including advertising and merchant tools, which can add higher-margin revenue on top of the existing consumer platform.
Recent company updates have also emphasized continued product integration, AI-enabled efficiency initiatives, and deeper merchant services. Those efforts matter because they can support both growth and margins at the same time, especially in a platform business where matching, routing, customer support, and marketing can all benefit from automation.
Risks
This article is for informational purposes only and does not constitute financial advice. Some content is AI-generated. See Disclaimer


