Stock Analysis · Group 1 Automotive Inc (GPI)
Overview
Group 1 Automotive is a large auto retailer that sells new and used vehicles, arranges vehicle financing and insurance products, and provides aftersales services such as maintenance, repairs, and parts. The company operates dealership networks in the United States and the United Kingdom, with a business model built around high-volume vehicle sales supported by recurring service revenue and finance-related income.
Its revenue mix is heavily weighted toward vehicle sales, which is typical for dealership groups, although profit is usually more balanced because service, parts, and finance activities tend to carry better margins than selling cars alone. Based on the company’s recent annual reporting structure, the main revenue sources can be summarized as follows:
- New vehicle retail sales: approximately 60% to 65% of revenue. This includes sales of new cars, SUVs, trucks, and fleet-related transactions across its franchised dealerships.
- Used vehicle retail sales: approximately 20% to 25% of revenue. This includes used cars sold directly to retail customers.
- Parts and service: approximately 10% to 15% of revenue. This covers repairs, maintenance, collision work, and parts sales; this is usually one of the most profitable activities.
- Finance, insurance, and other: approximately 3% to 6% of revenue. This includes arranging loans, leases, vehicle protection products, and related dealership income streams.
What stands out is that Group 1 has kept expanding revenue over the past several years, but a growing share of that sales base has been absorbed by higher operating costs and interest expense. Gross profit has increased since 2021, yet net income has moved lower from the peak period reached when dealership margins were unusually strong.
Key Figures
| Metric | Value | Sector ⓘ |
|---|---|---|
| Date | Sep 12, 2026 | |
| Context | ||
| Sector | Consumer Cyclical | |
| Industry | Auto & Truck Dealerships | |
| Market Cap ⓘ | $3.36B | |
| Beta ⓘ | 0.82 | |
Value (Cheapness) | ||
| P/E Ratio ⓘ | 11.91 | 17.10 |
| FCF Yield ⓘ | 4.11% | 8.53% |
| EBIT / EV ⓘ | 7.74% | 6.46% |
| PEG ⓘ | 0.32 | |
Growth (Business expansion) | ||
| Revenue Growth ⓘ | -5.60% | 5.75% |
| RPS Growth (5Y CAGR) ⓘ | 23.54% | 9.14% |
| EPS Growth (5Y CAGR) ⓘ | -23.11% | -18.21% |
| Margin Growth (5Y Trend) ⓘ | -3.19% | -0.23% |
| FCF Growth (5Y CAGR) ⓘ | -23.87% | 4.91% |
Quality (Business durability) | ||
| ROIC (Latest) ⓘ | 5.71% | 12.61% |
| ROIC (5Y Median) ⓘ | 12.44% | 10.72% |
| Net Debt / EBIT (Latest) ⓘ | 8.32 | 2.10 |
| Net Debt / EBIT (5Y Median) ⓘ | 3.98 | 2.32 |
| Operating Margin (Latest) ⓘ | 3.16% | 9.25% |
| Operating Margin (5Y Median) ⓘ | 5.39% | 9.64% |
| Debt to Equity (Latest) ⓘ | 202.68% | 75.78% |
| Profit Margin (Latest) ⓘ | 1.31% | 5.33% |
| Free Cash Flow (Latest) ⓘ | $138.10M | |
Momentum (Price trend) | ||
| 3Y Return ⓘ | +7.18% | +14.53% |
| 12M Return (excl. last month) ⓘ | -39.75% | +3.08% |
| 6M Return ⓘ | -7.17% | +0.55% |
| Price vs. 200-Day MA ⓘ | -16.50% | -0.54% |
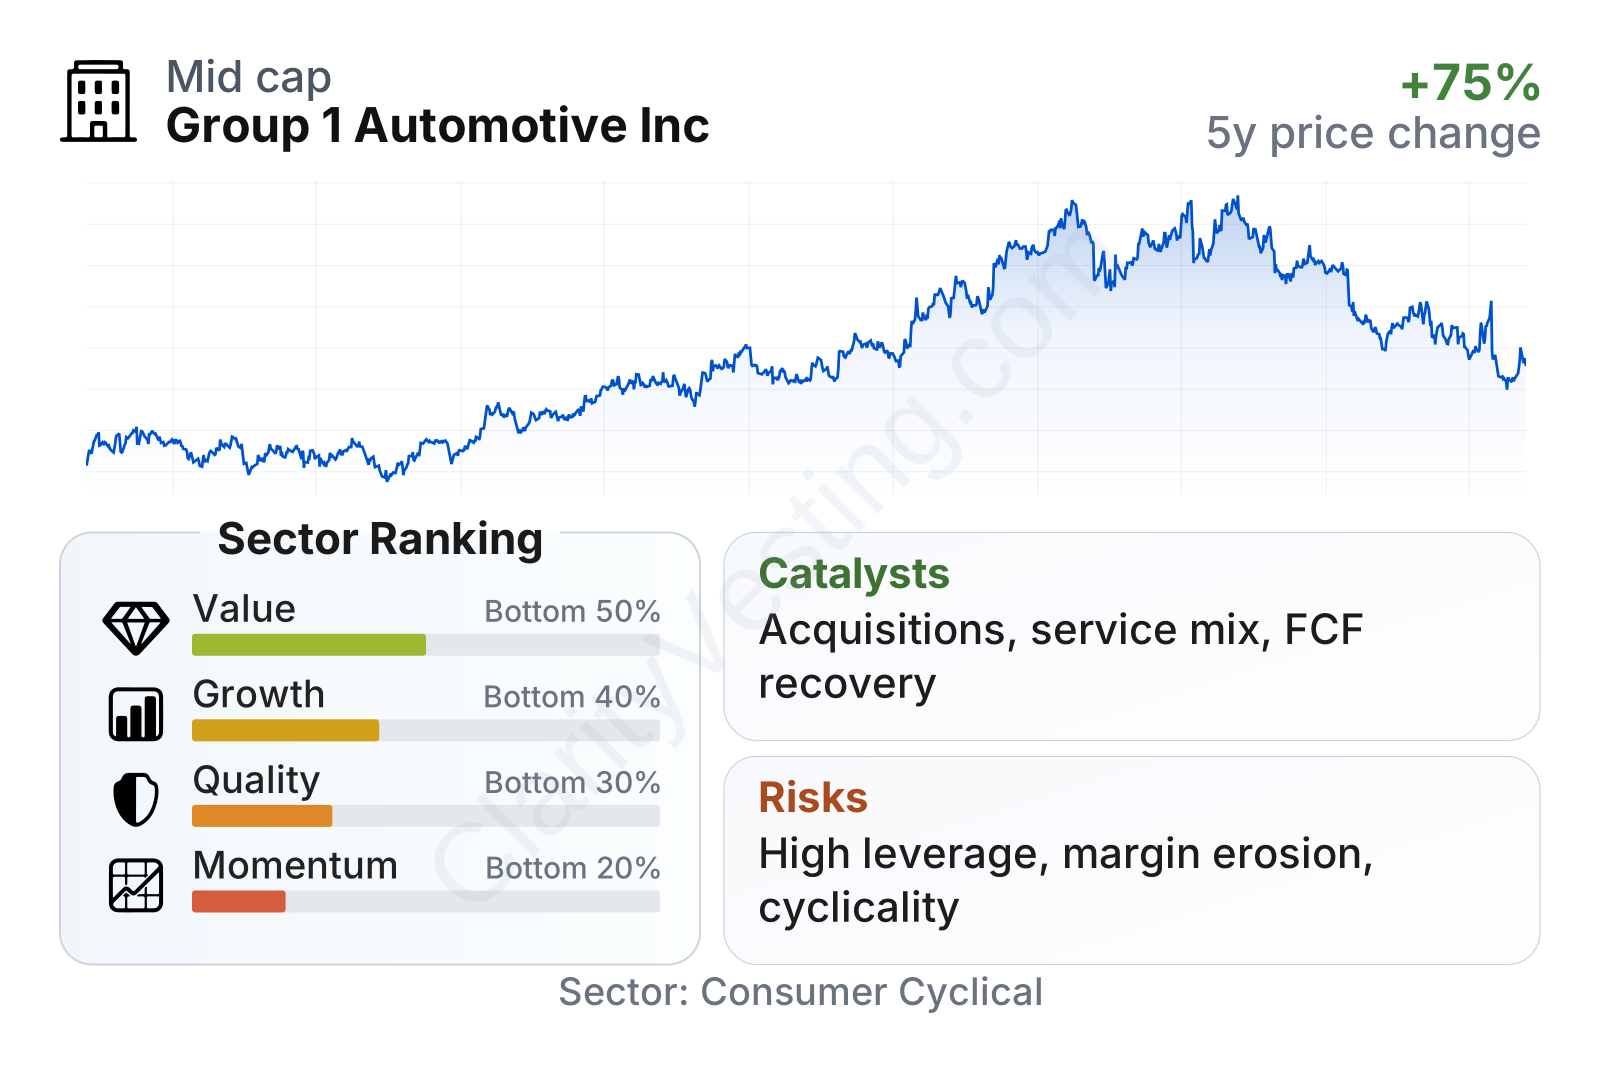
Group 1 sits in the mid-cap range and has shown lower share-price volatility than the broader market, as reflected by a beta below 1. On valuation, the stock trades at a price-to-earnings ratio in the low teens, below the sector median, which points to a more modest market expectation. At the same time, the company ranks weakly on quality, growth, and momentum compared with much of the sector. Profitability and balance-sheet leverage are the main pressure points, while valuation looks less demanding than many peers.
Growth
The company operates in a sector that can grow over time because the car market is large, highly fragmented, and supported by ongoing demand for replacement vehicles and maintenance. Dealership groups can also expand through acquisitions, adding scale, brand relationships, and local market density. Group 1 has followed that playbook for years, especially by enlarging its dealership base and broadening its geographic footprint.
A key point for long-term analysis is that this is not a pure high-growth business in the technology sense. It is more of a scale-and-execution business. Growth usually comes from a mix of dealership acquisitions, market share gains, used-vehicle activity, and a steady stream of service work from the installed base of vehicles already on the road. That makes aftersales operations especially important because they are less cyclical than new car sales and can provide a more stable earnings base.
Recent top-line momentum has cooled. Revenue growth was very strong in 2022 through 2025, but more recent year-over-year readings turned negative in 2026, indicating a tougher comparison period and a more normalized dealership environment. That does not necessarily mean the business is structurally shrinking, but it does show that the extraordinary conditions that once lifted dealer earnings have faded.
Management’s strategy still makes sense for future expansion if it can keep integrating acquisitions well, improve the used-vehicle mix, and continue building the higher-margin service and parts business. The UK platform adds another avenue for scale, though it also increases execution complexity and exposure to different consumer and regulatory conditions.
Cash generation has also become an important area to watch. Free cash flow fell sharply from the unusually strong levels seen earlier in the cycle, then recovered into 2025 and early 2026. That rebound suggests the business is still capable of generating meaningful cash even after the industry’s peak profitability passed, but the level remains more modest than what investors saw during the post-pandemic boom. A practical catalyst from here would be continued recovery in free cash flow combined with steadier margins.
Recent company updates have also highlighted ongoing portfolio actions, including acquisitions and dealership optimization. In this industry, those moves can matter because well-executed acquisitions may improve purchasing scale, spread fixed costs, and strengthen the company’s position with major auto brands. The opportunity is significant if added stores contribute more service revenue and if integration costs remain controlled.
Risks
This article is for informational purposes only and does not constitute financial advice. Some content is AI-generated. See Disclaimer


