Stock Analysis · Globalfoundries Inc (GFS)
Overview
GlobalFoundries is a semiconductor manufacturer, often called a foundry. That means it makes chips designed by other companies rather than designing most of the products itself. Its role is to provide manufacturing capacity and process technologies for customers in markets such as smartphones, communications infrastructure, automotive, industrial equipment, aerospace and defense, and data center applications. Unlike the companies competing at the very leading edge of chip miniaturization, GlobalFoundries focuses on what it calls essential chips and differentiated manufacturing platforms, including radio-frequency, power management, silicon photonics, and specialized manufacturing technologies that are built for reliability, connectivity, and lower power use.
The company’s revenue mainly comes from wafer fabrication and related manufacturing services. In its annual reporting, GlobalFoundries does not break revenue into many detailed line items with exact percentages for every technology family, but it does provide a useful customer and end-market picture. Based on the latest company filings and investor materials, the business is broadly supported by the following revenue sources:
- Wafer fabrication services: the core revenue stream, representing the large majority of total sales. This includes producing chips for fabless semiconductor companies and integrated device makers.
- Automotive, industrial, and infrastructure-related demand: an increasingly important part of the mix, supported by long product cycles and demand for specialty chips used in vehicles, factory systems, connectivity equipment, and power-related functions.
- Smart mobile devices: chips used in smartphones and connected consumer devices, especially radio-frequency components and connectivity-related semiconductors.
- Advanced packaging, mask, and other services: a smaller contribution tied to manufacturing support activities around chip production.
- Customer concentration: one customer accounted for about 12% of 2025 revenue, showing that the business is diversified but still exposed to a few large accounts.
Geographically, GlobalFoundries serves customers worldwide through fabs in the United States, Germany, and Singapore. This manufacturing footprint is one of its defining features because it gives customers access to production outside Taiwan and helps position the company as a strategic supplier for regional supply-chain resilience.
Over the last few years, the company’s financial structure shows a clear cycle: revenue climbed strongly in 2022, softened through 2023 and 2024 as the semiconductor market normalized, and then profitability recovered in 2025. The more encouraging element is that operating discipline improved again after the 2024 downturn, even while research and development spending remained meaningful.
The long-term picture is of a company that is not built around the most advanced processors, but around specialized chips that remain critical in many products and tend to have longer commercial lives.
Key Figures
| Metric | Value | Sector ⓘ |
|---|---|---|
| Date | Sep 12, 2026 | |
| Context | ||
| Sector | Technology | |
| Industry | Semiconductors | |
| Market Cap ⓘ | $25.22B | |
| Beta ⓘ | 1.77 | |
Value (Cheapness) | ||
| P/E Ratio ⓘ | 35.91 | 29.51 |
| FCF Yield ⓘ | 3.16% | 4.25% |
| EBIT / EV ⓘ | 3.48% | 2.85% |
| PEG ⓘ | 0.69 | |
Growth (Business expansion) | ||
| Revenue Growth ⓘ | 5.80% | 15.40% |
| RPS Growth (5Y CAGR) ⓘ | -1.67% | 8.56% |
| EPS Growth (5Y CAGR) ⓘ | -33.94% | -11.88% |
| Margin Growth (5Y Trend) ⓘ | 14.58% | 0.46% |
| FCF Growth (5Y CAGR) ⓘ | -1.50% | 9.80% |
Quality (Business durability) | ||
| ROIC (Latest) ⓘ | 5.42% | 9.44% |
| ROIC (5Y Median) ⓘ | 6.92% | 8.30% |
| Net Debt / EBIT (Latest) ⓘ | 0.69 | 0.54 |
| Net Debt / EBIT (5Y Median) ⓘ | 0.31 | 0.44 |
| Operating Margin (Latest) ⓘ | 12.31% | 9.58% |
| Operating Margin (5Y Median) ⓘ | 13.41% | 8.25% |
| Debt to Equity (Latest) ⓘ | 14.20% | 33.33% |
| Profit Margin (Latest) ⓘ | 10.32% | 7.14% |
| Free Cash Flow (Latest) ⓘ | $796.00M | |
Momentum (Price trend) | ||
| 3Y Return ⓘ | -21.73% | +45.48% |
| 12M Return (excl. last month) ⓘ | +62.17% | +23.48% |
| 6M Return ⓘ | +13.05% | +20.93% |
| Price vs. 200-Day MA ⓘ | -12.23% | +7.43% |
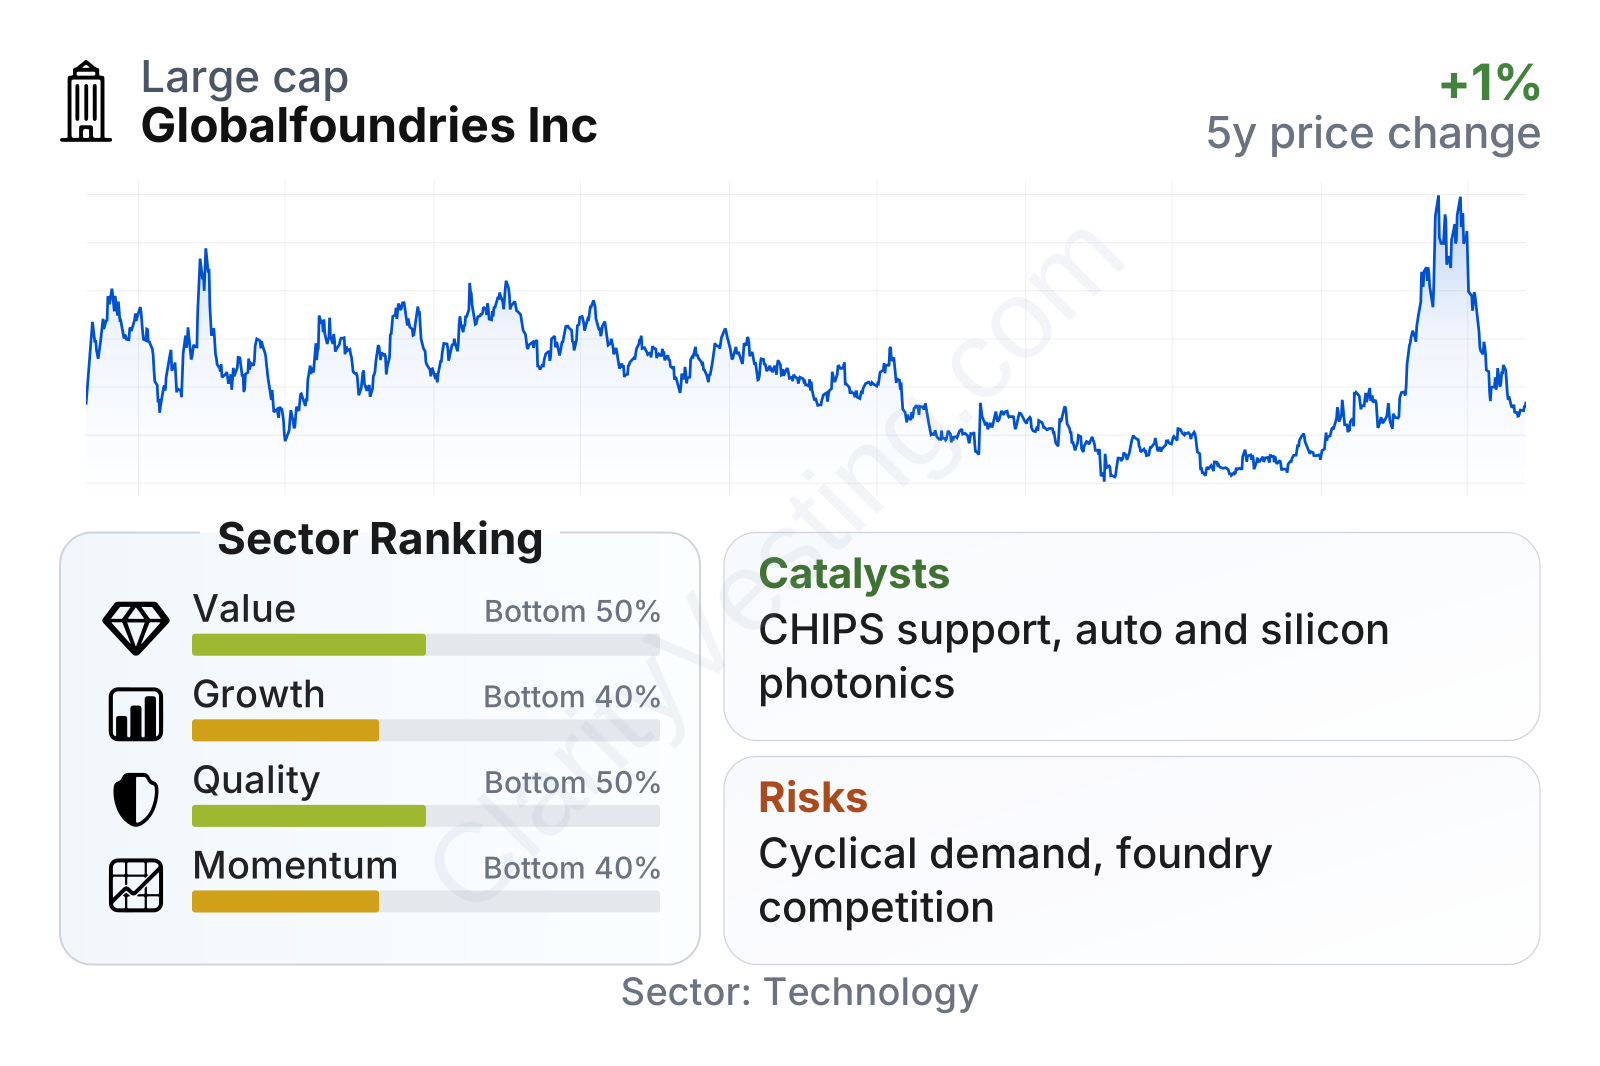
GlobalFoundries is a large semiconductor company by market value, but it sits in the middle tier compared with the biggest global foundries and integrated chip manufacturers. The recent profile is mixed. Profitability metrics are stronger than many sector peers, with operating margin around 12% and profit margin around 10%, while balance-sheet leverage is relatively modest, with debt to equity close to 14%. On the other hand, growth metrics remain weaker than the sector median, which helps explain why the valuation metrics do not look especially cheap despite the company’s recovery in earnings and cash generation.
The stock has also been volatile. Over the full period since listing, the share price has not delivered a smooth upward trend, but the shorter-term rebound into 2026 has been much stronger than the broader sector median. That combination suggests improving sentiment, though not yet a long record of sustained market outperformance.
Growth
GlobalFoundries operates in a sector with attractive long-term demand. Semiconductor content keeps rising in vehicles, industrial systems, communications gear, AI infrastructure, and connected devices. Importantly, not all of that growth requires the smallest and most advanced nodes. Many applications need chips optimized for power efficiency, radio performance, sensor integration, durability, or secure communications, which fits GlobalFoundries’ specialty-manufacturing focus.
The company’s strategy is built around that idea. Rather than trying to match the enormous spending race at the leading edge, it concentrates on differentiated processes where customers value reliability and design-specific features. This strategy makes sense because it reduces direct confrontation with the most capital-intensive leaders while giving the company a clearer niche in automotive, aerospace and defense, communications, and industrial markets.
Recent revenue trends show a recovery, but not a rapid one.
After a sharp downturn from 2023 into 2024, year-over-year revenue growth turned positive again and improved into mid-2026, reaching the mid-single-digit range. That is a constructive change in direction, but still slower than the broader semiconductor sector median, which indicates that GlobalFoundries is recovering rather than accelerating ahead of the industry.
Cash generation is an important support for the growth case.
Free cash flow returned to a little over $1 billion on a trailing basis after a major swing into negative territory in 2023. For a foundry business, that matters because manufacturing requires heavy and recurring capital investment. The ability to stay cash generative while expanding specialty capacity suggests the company has more resilience than a simple revenue trend might imply.
Several catalysts could support future expansion. GlobalFoundries has continued to emphasize long-term supply agreements, especially in automotive and communications. It also benefits from government support for domestic semiconductor manufacturing in the United States and Europe, where customers and policymakers want more geographically diversified production. In addition, the company has highlighted opportunities in silicon photonics, gallium nitride power technologies, and advanced packaging partnerships. These are not mass-market smartphone features alone; they connect to data centers, AI networking, electric power systems, and defense-related electronics.
Recent company announcements have also reinforced the strategic angle of the business: additional manufacturing and packaging partnerships, government-backed ecosystem development, and programs linked to secure domestic supply. Those developments do not automatically guarantee fast growth, but they strengthen the company’s relevance in parts of the market where location and process specialization matter.
Risks
This article is for informational purposes only and does not constitute financial advice. Some content is AI-generated. See Disclaimer


