Stock Analysis · GCL-Poly Energy Holdings Limited (GCPEF)
Overview
GCL-Poly Energy Holdings Limited, now commonly referred to in company materials as GCL Technology, is a Chinese solar materials manufacturer focused on the upstream part of the photovoltaic supply chain. In simple terms, it makes the refined silicon materials that solar wafer and solar cell producers need to build solar panels. That position matters because upstream suppliers can benefit when solar installations keep growing globally, but they are also very exposed to swings in commodity-like pricing.
The group’s core business is polysilicon, especially granular silicon produced through fluidized bed reactor technology. This material is sold to wafer manufacturers and is used to produce solar cells and modules. The company has also had operations in wafer-related businesses and other solar-industry activities, but the business mix has become increasingly centered on silicon materials.
Based on recent annual reporting and company disclosures, revenue is heavily concentrated in a small number of activities:
- Solar material business, mainly polysilicon and granular silicon: approximately 80% to 90% of revenue. This is the company’s economic engine and includes sales of photovoltaic-grade silicon materials used by downstream manufacturers.
- Wafer and related solar processing activities: approximately 10% to 20% of revenue. This has been a smaller contributor and has become less central than the silicon material segment.
- Other and ancillary activities: a low-single-share portion of revenue where separately disclosed, including supporting industrial and operating items.
The important takeaway is that GCL-Poly is not a diversified utility-like solar company. It is much more concentrated: its results rise and fall mostly with polysilicon pricing, production efficiency, and its ability to keep costs below competitors.
The company’s profit path has changed sharply over the last few years. Revenue surged in 2022, stayed high in 2023, then fell steeply in 2024 and remained under pressure afterward. At the same time, profitability moved from very strong levels into losses, showing how sensitive the model is to industry oversupply and pricing declines.
The operating picture shows a boom-and-bust pattern rather than steady compounding. Revenue expanded dramatically in 2022, but margins later collapsed as selling prices weakened faster than costs. That makes the business easier to understand: scale is important, but pricing power is limited when too much capacity enters the market.
Key Figures
| Metric | Value | Sector ⓘ |
|---|---|---|
| Date | Sep 12, 2026 | |
| Context | ||
| Sector | Technology | |
| Industry | Solar | |
| Market Cap ⓘ | $3.48B | |
| Beta ⓘ | 0.68 | |
Value (Cheapness) | ||
| P/E Ratio ⓘ | N/A | 29.51 |
| FCF Yield ⓘ | -111.51% | 4.25% |
| EBIT / EV ⓘ | N/A | 2.85% |
| PEG ⓘ | N/A | |
Growth (Business expansion) | ||
| Revenue Growth ⓘ | 0.70% | 15.40% |
| RPS Growth (5Y CAGR) ⓘ | -8.14% | 8.56% |
| EPS Growth (5Y CAGR) ⓘ | N/A | -11.88% |
| Margin Growth (5Y Trend) ⓘ | -55.78% | 0.46% |
| FCF Growth (5Y CAGR) ⓘ | N/A | 9.80% |
Quality (Business durability) | ||
| ROIC (Latest) ⓘ | N/A | 9.44% |
| ROIC (5Y Median) ⓘ | 6.41% | 8.30% |
| Net Debt / EBIT (Latest) ⓘ | N/A | 0.54 |
| Net Debt / EBIT (5Y Median) ⓘ | 0.97 | 0.44 |
| Operating Margin (Latest) ⓘ | -25.68% | 9.58% |
| Operating Margin (5Y Median) ⓘ | 14.00% | 8.25% |
| Debt to Equity (Latest) ⓘ | 48.71% | 33.33% |
| Profit Margin (Latest) ⓘ | -21.93% | 7.14% |
| Free Cash Flow (Latest) ⓘ | -$3.88B | |
Momentum (Price trend) | ||
| 3Y Return ⓘ | -26.91% | +45.48% |
| 12M Return (excl. last month) ⓘ | -16.67% | +23.48% |
| 6M Return ⓘ | -21.43% | +20.93% |
| Price vs. 200-Day MA ⓘ | -9.95% | +7.43% |
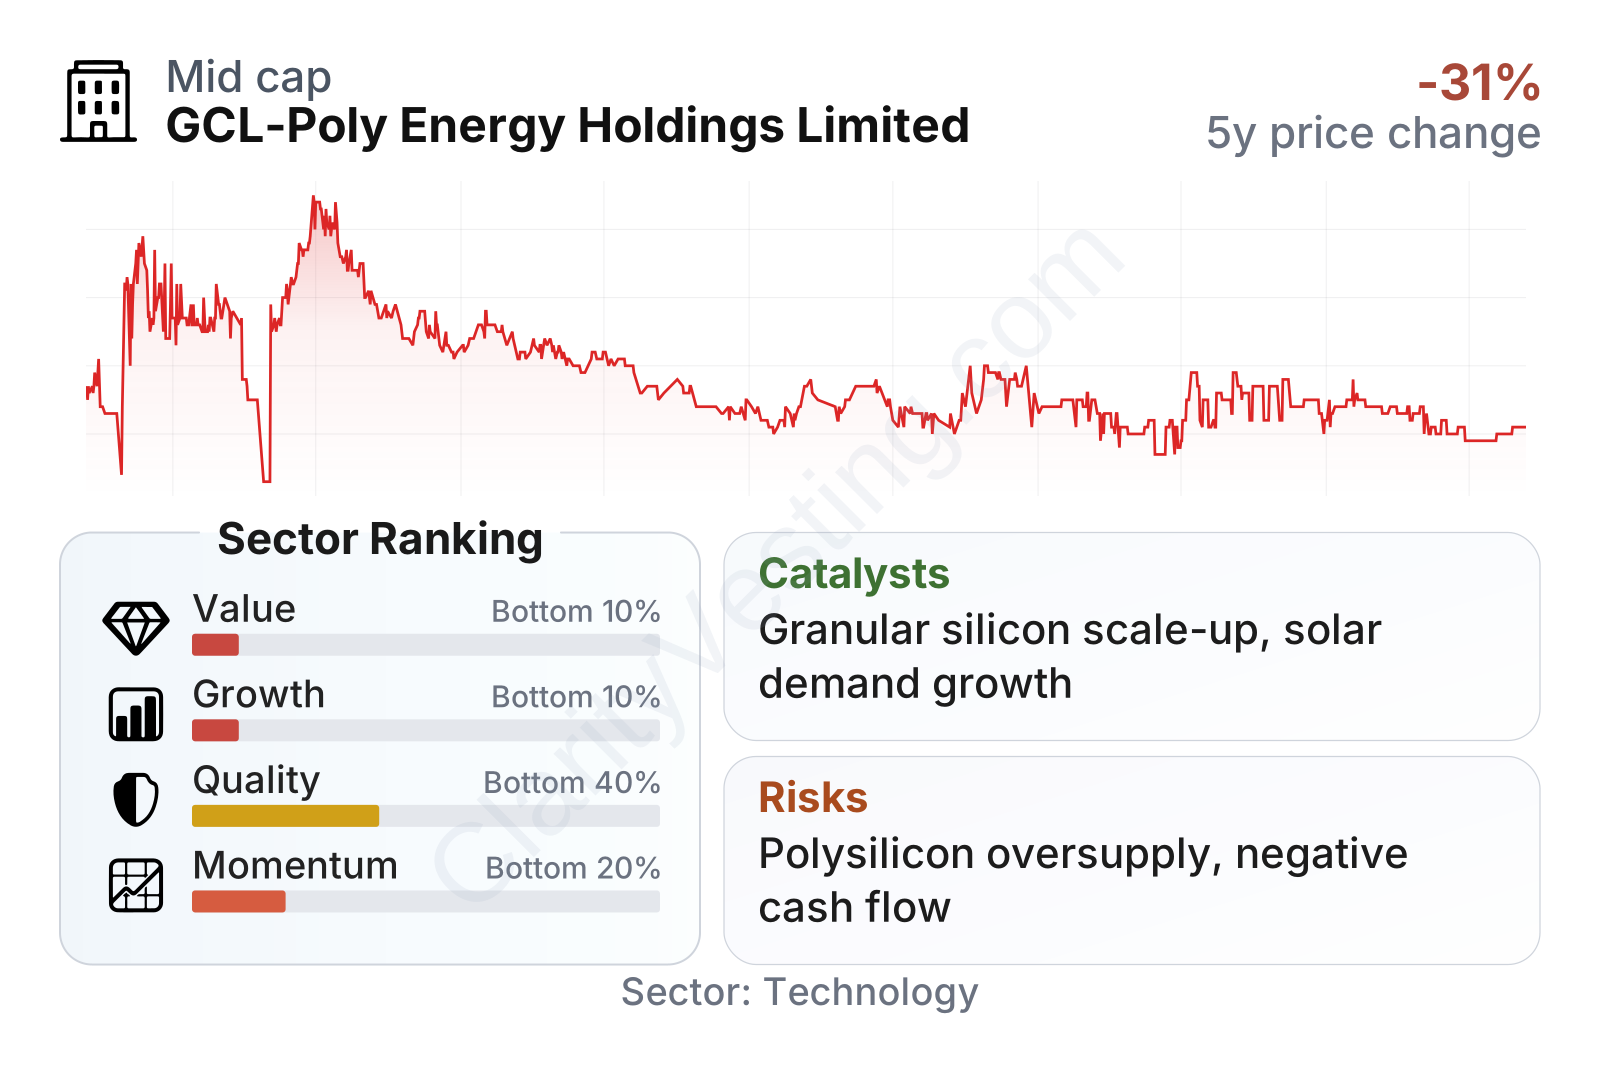
The broad snapshot is weak. The company sits near the bottom of the sector on value, growth, and momentum measures, while quality is below average. The main reason is not simply a low share price. It is the combination of negative free cash flow, loss-making operations, and weaker long-term trends despite a recent rebound in year-over-year revenue growth. The relatively modest beta suggests the stock has not moved as violently as some technology names, but operationally the business has been much more unstable than that figure alone implies.
The stock history also reflects that instability. Shares traded far higher in 2021 and 2022, then moved into a prolonged decline and have remained at depressed levels through 2026. That pattern usually signals that the market is waiting for evidence of a durable industry recovery rather than reacting to a single short-term event.
Growth
GCL-Poly operates in a sector with strong long-term structural demand. Global solar installation keeps expanding because solar power is one of the cheapest sources of new electricity generation in many regions, and governments continue to support decarbonization, local energy security, and grid expansion. That backdrop is favorable for upstream material suppliers over a full cycle.
Its strategy also has a clear logic. The company has emphasized granular silicon, where management has long argued it can achieve lower energy consumption, lower production cost, and better scalability than some traditional methods. If that cost advantage holds through weak pricing environments, it can help the company protect volumes and recover profitability earlier than higher-cost rivals when the cycle improves.
Recent growth signals are mixed. On one hand, year-over-year revenue growth has recently rebounded to around 39%, ahead of the sector median. On the other hand, that improvement comes after a severe contraction period, and the five-year trend in revenue per share remains negative. In other words, there are signs of stabilization, but not yet proof of a strong and sustained growth path.
Cash generation remains the bigger issue. Free cash flow is deeply negative, which means the company has recently been consuming cash rather than producing it. For a cyclical manufacturer, that matters because it reduces flexibility exactly when the industry is under pressure. A future inflection would likely need to come from some combination of better selling prices, tighter industry supply, improved utilization, and cost discipline.
One practical catalyst is industry consolidation. Solar materials have gone through aggressive capacity additions across China, which pushed prices down. If weaker producers cut output, delay expansion, or exit, stronger and lower-cost operators could benefit. Another catalyst is the continued adoption of advanced solar technologies that require high-purity silicon feedstock, where process know-how and scale can matter more.
Recent company communications have also highlighted continued development of granular silicon production and technology upgrades. That does not remove cyclicality, but it supports the idea that management is still positioning the business around cost efficiency rather than trying to outgrow the market at any price.
Risks
This article is for informational purposes only and does not constitute financial advice. Some content is AI-generated. See Disclaimer


