Stock Analysis · Global Business Travel Group Inc (GBTG)
Overview
Global Business Travel Group Inc, known commercially as Amex GBT, is a corporate travel platform focused on business customers rather than vacation travelers. The company helps corporations, government bodies, and other organizations manage employee travel, including air, hotel, rail, car rental, expense capture, policy compliance, meetings support, and traveler assistance. Its role is partly service-based and partly technology-based: clients use its software and travel tools, while the company also provides agents, consulting, and supplier management.
The business model is built around the flow of business travel spending. Revenue comes mainly from transaction and management activity tied to booked travel, along with software and service fees. Based on recent annual reporting, the main sources of revenue can be summarized as follows:
- Travel revenue and related transaction activity: approximately 75% to 80% — fees and revenue tied to booking and servicing air, hotel, and other corporate travel.
- Product and professional services: approximately 15% to 20% — travel management services, consulting, meetings and events support, and other client-facing service activity.
- Software and solutions revenue: approximately 5% to 10% — technology offerings such as booking tools, expense-related solutions, and travel program management software.
This is a large but still specialized company in travel services, with revenue that has risen sharply since the pandemic recovery period. The financial flow also shows a meaningful improvement over the last several years: revenue has expanded from well under $1 billion in 2021 to more than $2.7 billion in 2025, while operating income moved from a heavy loss to a solid positive level. That said, profitability remains more modest than the top-line recovery alone might suggest.
The long-term pattern is clear: sales recovery has been strong, gross profit has grown, and operating discipline has improved, but interest costs and ongoing technology spending still matter a lot to the final earnings result.
Key Figures
| Metric | Value | Sector ⓘ |
|---|---|---|
| Date | Sep 12, 2026 | |
| Context | ||
| Sector | Consumer Cyclical | |
| Industry | Travel Services | |
| Market Cap ⓘ | $4.95B | |
| Beta ⓘ | 0.93 | |
Value (Cheapness) | ||
| P/E Ratio ⓘ | 59.25 | 17.10 |
| FCF Yield ⓘ | 2.06% | 8.53% |
| EBIT / EV ⓘ | 2.14% | 6.46% |
| PEG ⓘ | N/A | |
Growth (Business expansion) | ||
| Revenue Growth ⓘ | 37.90% | 5.75% |
| RPS Growth (5Y CAGR) ⓘ | 29.95% | 9.14% |
| EPS Growth (5Y CAGR) ⓘ | N/A | -18.21% |
| Margin Growth (5Y Trend) ⓘ | N/A | -0.23% |
| FCF Growth (5Y CAGR) ⓘ | N/A | 4.91% |
Quality (Business durability) | ||
| ROIC (Latest) ⓘ | 9.78% | 12.61% |
| ROIC (5Y Median) ⓘ | 0.61% | 10.72% |
| Net Debt / EBIT (Latest) ⓘ | 8.38 | 2.10 |
| Net Debt / EBIT (5Y Median) ⓘ | N/A | 2.32 |
| Operating Margin (Latest) ⓘ | 4.06% | 9.25% |
| Operating Margin (5Y Median) ⓘ | -0.17% | 9.64% |
| Debt to Equity (Latest) ⓘ | 97.56% | 75.78% |
| Profit Margin (Latest) ⓘ | 2.77% | 5.33% |
| Free Cash Flow (Latest) ⓘ | $102.00M | |
Momentum (Price trend) | ||
| 3Y Return ⓘ | +72.94% | +14.53% |
| 12M Return (excl. last month) ⓘ | +22.44% | +3.08% |
| 6M Return ⓘ | +72.00% | +0.55% |
| Price vs. 200-Day MA ⓘ | +20.89% | -0.54% |
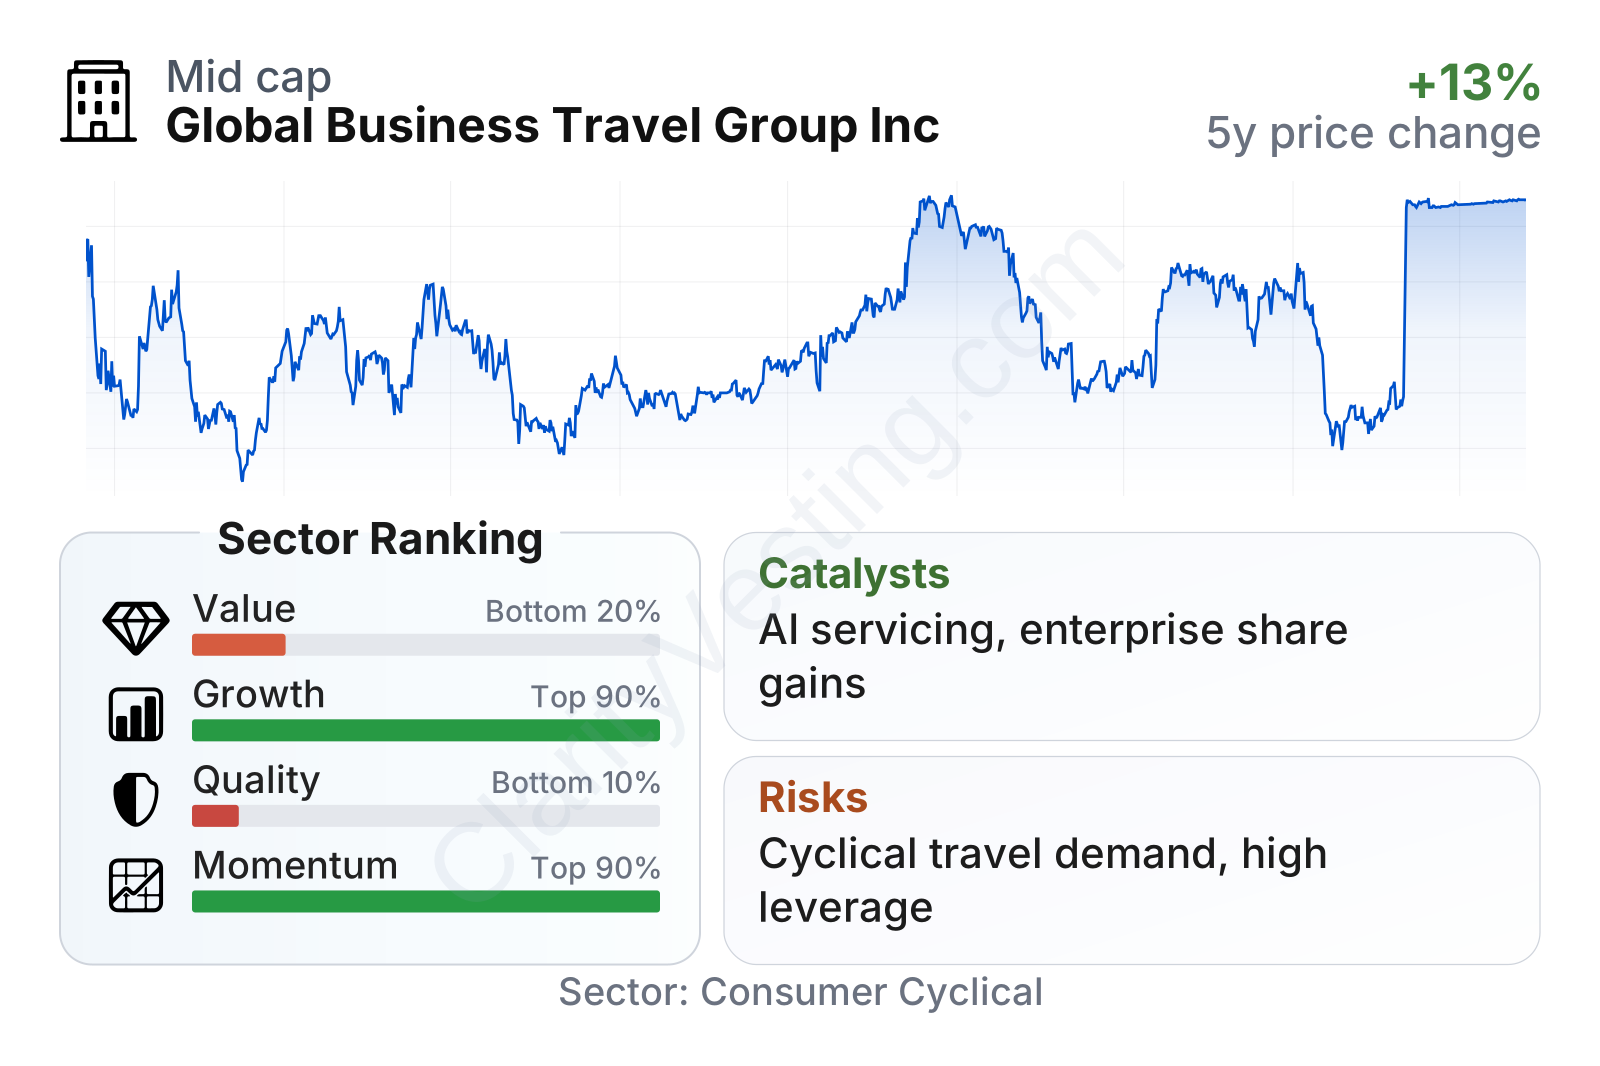
Recent market performance has been strong relative to most companies in the sector, and growth metrics also rank near the top of the peer group. The weaker area is business quality: margins, returns on capital, and leverage still trail sector norms. Valuation metrics also sit in the expensive range, which suggests the market is already recognizing a meaningful part of the recovery and expansion potential.
Growth
Corporate travel remains a recovery and modernization market rather than a mature, no-growth niche. Over time, companies still need travel for sales, client service, internal coordination, and events, but they increasingly want tighter control over budgets, emissions reporting, traveler safety, and policy compliance. That trend supports the use of managed travel platforms, especially those with global scale and integrated technology.
Global Business Travel Group appears well positioned for that direction. Its strategy combines travel management scale with software tools, which can deepen client relationships and make programs harder to replace. The company has also been active in expanding its platform through acquisitions and partnerships, aiming to gain more volume, more customer data, and more cross-selling opportunities. In a business where scale improves supplier relationships and service economics, that approach is strategically coherent.
The revenue trend shows two phases. First came the post-pandemic rebound, when growth rates were exceptionally high. More recently, growth reaccelerated after a slower period, with year-over-year expansion climbing back into the mid-30% range by 2026. That is far above the sector median and indicates the company is not relying only on a broad travel recovery; it is also benefiting from business mix, execution, and consolidation effects.
Cash generation tells a more mixed but still useful story. Free cash flow moved from deeply negative levels in 2022 to positive territory in 2024 and 2025, confirming that the business can convert recovery into cash. The more recent pullback shows that cash flow is not yet smooth, which is common in a transaction-heavy, integration-driven business. Even so, the broader direction from cash burn to positive free cash flow is an important improvement.
A key catalyst for future expansion is the ongoing shift by enterprises toward outsourced and technology-enabled travel management. Another is the possibility of additional share gains as customers prefer fewer global providers with strong servicing capabilities. Recent company updates have also emphasized AI-enabled servicing, productivity improvements, and broader platform integration, all of which could support margins if execution remains disciplined.
Risks
This article is for informational purposes only and does not constitute financial advice. Some content is AI-generated. See Disclaimer


