Stock Analysis · The Gap Inc (GAP)
Overview
The Gap, Inc. is a large apparel retailer that sells clothing, accessories, and personal care products through stores, e-commerce websites, and franchise locations. Its brand portfolio is built around Old Navy, Gap, Banana Republic, and Athleta. The company mainly serves consumers looking for casualwear, family basics, denim, activewear, and work-to-weekend clothing, with North America still representing the core of the business.
Revenue is primarily generated by brand sales rather than by a separate manufacturing or licensing-heavy model. Based on the latest annual reporting, the mix is approximately as follows:
- Old Navy: about 55% of revenue. This is the company’s largest brand and focuses on value-priced family apparel, including women’s, men’s, kids’, toddler, and baby clothing.
- Gap brand: about 24% of revenue. This includes Gap adult, GapKids, babyGap, and related online sales, centered on casual basics and denim.
- Banana Republic: about 13% of revenue. This business is more focused on elevated apparel, accessories, and work-oriented fashion.
- Athleta: about 8% of revenue. Athleta sells women’s activewear, wellness apparel, and lifestyle products.
Geographically, the business is still heavily concentrated in the United States, with international revenue coming from company-operated stores, online channels, and franchise partners. In practice, Gap is best understood as a multi-brand retail operator whose performance depends on brand relevance, merchandising execution, inventory discipline, pricing, and digital engagement.
The recent financial profile shows a company that has stabilized after a difficult period in 2022 and 2023. Revenue has not returned to earlier peaks, but profitability and cash generation improved meaningfully, helped by better merchandise margins, tighter expense control, and lower interest expense. That matters in apparel retail, where small improvements in markdowns and inventory management can quickly change earnings.
The business has become more efficient than it was a few years ago. Sales remain below the levels seen earlier in the decade, but gross profit, operating income, and net income recovered strongly from the downturn, showing that the recent improvement came more from execution and margin repair than from rapid top-line expansion.
Key Figures
| Metric | Value | Sector ⓘ |
|---|---|---|
| Date | Sep 12, 2026 | |
| Context | ||
| Sector | Consumer Cyclical | |
| Industry | Apparel Retail | |
| Market Cap ⓘ | $7.56B | |
| Beta ⓘ | 2.06 | |
Value (Cheapness) | ||
| P/E Ratio ⓘ | 6.29 | 17.10 |
| FCF Yield ⓘ | 14.69% | 8.53% |
| EBIT / EV ⓘ | 11.98% | 6.46% |
| PEG ⓘ | 1.08 | |
Growth (Business expansion) | ||
| Revenue Growth ⓘ | -2.00% | 5.75% |
| RPS Growth (5Y CAGR) ⓘ | -2.08% | 9.14% |
| EPS Growth (5Y CAGR) ⓘ | N/A | -18.21% |
| Margin Growth (5Y Trend) ⓘ | 4.58% | -0.23% |
| FCF Growth (5Y CAGR) ⓘ | 63.56% | 4.91% |
Quality (Business durability) | ||
| ROIC (Latest) ⓘ | 17.63% | 12.61% |
| ROIC (5Y Median) ⓘ | N/A | 10.72% |
| Net Debt / EBIT (Latest) ⓘ | 2.85 | 2.10 |
| Net Debt / EBIT (5Y Median) ⓘ | 4.06 | 2.32 |
| Operating Margin (Latest) ⓘ | 8.27% | 9.25% |
| Operating Margin (5Y Median) ⓘ | 4.34% | 9.64% |
| Debt to Equity (Latest) ⓘ | 144.77% | 75.78% |
| Profit Margin (Latest) ⓘ | 8.14% | 5.33% |
| Free Cash Flow (Latest) ⓘ | $1.11B | |
Momentum (Price trend) | ||
| 3Y Return ⓘ | +111.13% | +14.53% |
| 12M Return (excl. last month) ⓘ | +2.12% | +3.08% |
| 6M Return ⓘ | -5.47% | +0.55% |
| Price vs. 200-Day MA ⓘ | -8.85% | -0.54% |
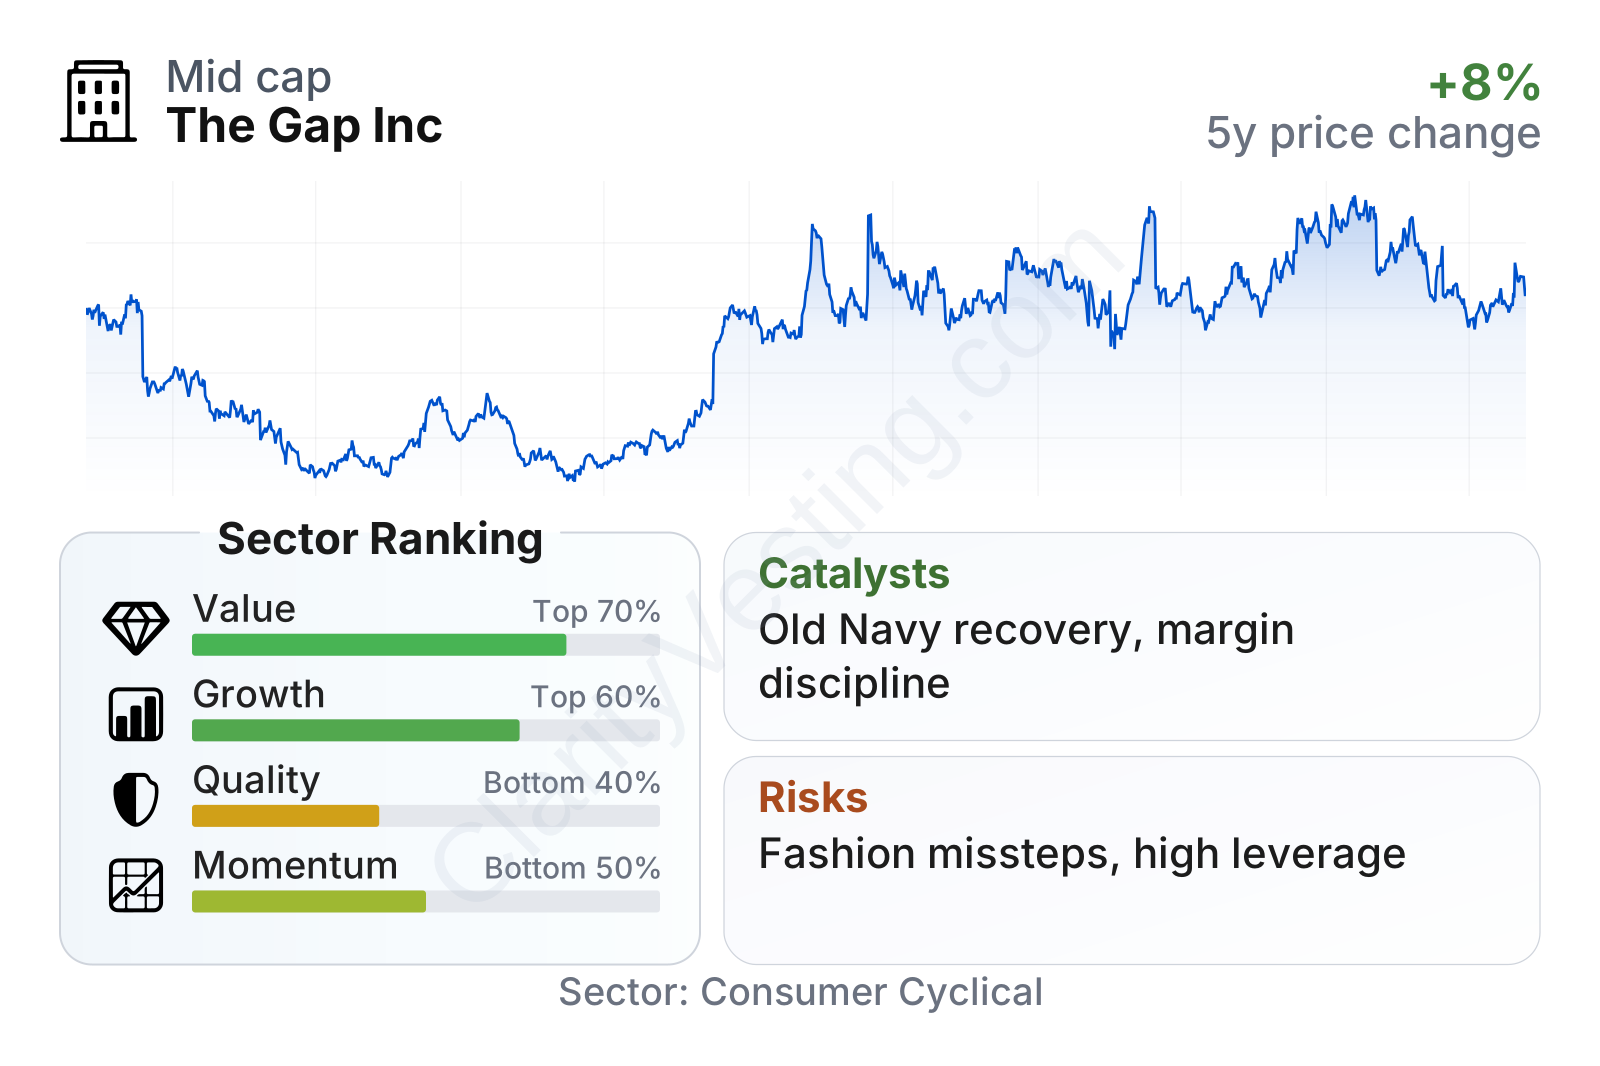
Gap stands in the mid-to-large range within apparel retail by size, but its share price behavior remains volatile, with a beta above 2. On valuation and cash-generation measures, it screens better than much of the sector: earnings multiple, free cash flow yield, and operating earnings relative to enterprise value all look favorable. Growth is more mixed, with recent revenue softness offset by a much better margin trend and a strong recovery in cash flow. Quality indicators are uneven: returns on invested capital and margins are solid, but leverage is still higher than the sector norm.
The share price history reflects that split picture. Over the last three years, the stock rebounded sharply from depressed 2022–2023 levels, yet the more recent trend has been choppier, with weakness over the last six months. That usually signals a market still debating whether the operational turnaround can become durable growth rather than a one-cycle recovery.
Growth
Gap operates in a sector that is mature rather than structurally high-growth. Apparel retail can still produce growth, but it is usually driven by brand heat, market share gains, international expansion, digital execution, and category strength rather than by overall industry tailwinds. That means the company’s future depends less on being in a booming market and more on whether each brand can stay relevant and defend pricing power.
Its current strategy is sensible for that environment. Management has focused on product relevance, tighter inventory control, cost discipline, store fleet optimization, and stronger brand execution. For a retailer like Gap, this approach can be more effective than aggressive expansion, because improved full-price selling and fewer markdowns can lift profit even when revenue growth is modest.
Revenue growth has been inconsistent. After a prolonged stretch of declines in 2022 and 2023, the business returned to low positive growth during much of 2024 and 2025, but the latest year-over-year reading slipped back slightly negative, around 2% below the prior year. This suggests the turnaround is real, but still fragile. The company is improving operations faster than it is expanding sales.
Cash generation is one of the most encouraging parts of the picture. Free cash flow moved from negative territory in 2023 to roughly $1.0 billion or more in the following years, staying near that level even as sales growth remained muted. That indicates stronger discipline in inventory, expenses, and capital spending. In a retailer, durable cash flow matters because it supports debt reduction, store investment, and shareholder returns without requiring fast revenue growth.
A meaningful catalyst is the continued revitalization of Old Navy and the broader portfolio reset under newer leadership. Old Navy is crucial because it contributes more than half of company revenue, so even modest gains in product acceptance or traffic can move the group’s results materially. Another catalyst is margin durability: if Gap can sustain better merchandise margins and leaner operating costs, earnings can hold up even in a slow consumer environment.
There is also a digital and omnichannel angle. Gap’s brands already have established online reach, and better coordination between stores, websites, fulfillment, and loyalty programs can support both convenience and inventory efficiency. This is not a breakthrough growth engine on its own, but it can help protect relevance and improve unit economics over time.
Risks
This article is for informational purposes only and does not constitute financial advice. Some content is AI-generated. See Disclaimer


