Stock Analysis · Six Flags Entertainment Corporation (FUN)
Overview
Six Flags Entertainment Corporation is a regional amusement park operator in North America. After the merger between legacy Cedar Fair and legacy Six Flags closed in 2024, the combined company owns and operates a large portfolio of amusement parks, water parks, and resort properties spread across the United States, Mexico, and Canada. Its business is straightforward: attract guests to parks, encourage them to spend more once they are inside, and use season passes, memberships, and resort offerings to increase repeat visits and smooth demand across the year.
The company’s revenue mix is still centered on guest spending inside and around its parks. Based on the latest annual filing, the largest sources of revenue are approximately:
- Admissions: about 41% — single-day tickets, season passes, memberships, and other entry products.
- In-park food, beverage, merchandise, and games: about 34% — spending once guests are inside the parks.
- Lodging, extra-charge experiences, and other revenue: about 17% — resorts, campgrounds, premium products, sponsorships, and other ancillary items.
- Parking and related fees: about 8% — vehicle parking and certain guest access-related charges.
That mix matters because it shows this is not just a ticket-selling company. A meaningful share of the business depends on guest spending per capita, pricing discipline, and cross-selling premium experiences, which can support revenue even when attendance is uneven.
The broader picture is that the combined park footprint gives Six Flags notable scale in regional leisure. It reaches families looking for close-to-home entertainment rather than destination travel on the scale of Disney or Universal. That makes the company more exposed to local consumer behavior and weather, but it also gives it a large installed base of repeat visitors within driving distance of its parks.
The business became much larger after the merger, but profitability did not scale cleanly. Revenue expanded sharply, while operating costs, selling expenses, and interest expense also rose materially. That helps explain why the combined company now has far more sales than a few years ago, but much weaker bottom-line performance.
Key Figures
| Metric | Value | Sector ⓘ |
|---|---|---|
| Date | Sep 12, 2026 | |
| Context | ||
| Sector | Consumer Cyclical | |
| Industry | Leisure | |
| Market Cap ⓘ | $1.40B | |
| Beta ⓘ | 0.37 | |
Value (Cheapness) | ||
| P/E Ratio ⓘ | N/A | 17.10 |
| FCF Yield ⓘ | 10.73% | 8.53% |
| EBIT / EV ⓘ | -21.10% | 6.46% |
| PEG ⓘ | 2.43 | |
Growth (Business expansion) | ||
| Revenue Growth ⓘ | -7.00% | 5.75% |
| RPS Growth (5Y CAGR) ⓘ | 6.62% | 9.14% |
| EPS Growth (5Y CAGR) ⓘ | N/A | -18.21% |
| Margin Growth (5Y Trend) ⓘ | -55.28% | -0.23% |
| FCF Growth (5Y CAGR) ⓘ | N/A | 4.91% |
Quality (Business durability) | ||
| ROIC (Latest) ⓘ | -19.31% | 12.61% |
| ROIC (5Y Median) ⓘ | -0.67% | 10.72% |
| Net Debt / EBIT (Latest) ⓘ | N/A | 2.10 |
| Net Debt / EBIT (5Y Median) ⓘ | 11.60 | 2.32 |
| Operating Margin (Latest) ⓘ | -50.28% | 9.25% |
| Operating Margin (5Y Median) ⓘ | 11.62% | 9.64% |
| Debt to Equity (Latest) ⓘ | 4495.25% | 75.78% |
| Profit Margin (Latest) ⓘ | -57.25% | 5.33% |
| Free Cash Flow (Latest) ⓘ | $150.14M | |
Momentum (Price trend) | ||
| 3Y Return ⓘ | -64.98% | +14.53% |
| 12M Return (excl. last month) ⓘ | -35.78% | +3.08% |
| 6M Return ⓘ | -15.74% | +0.55% |
| Price vs. 200-Day MA ⓘ | -26.11% | -0.54% |
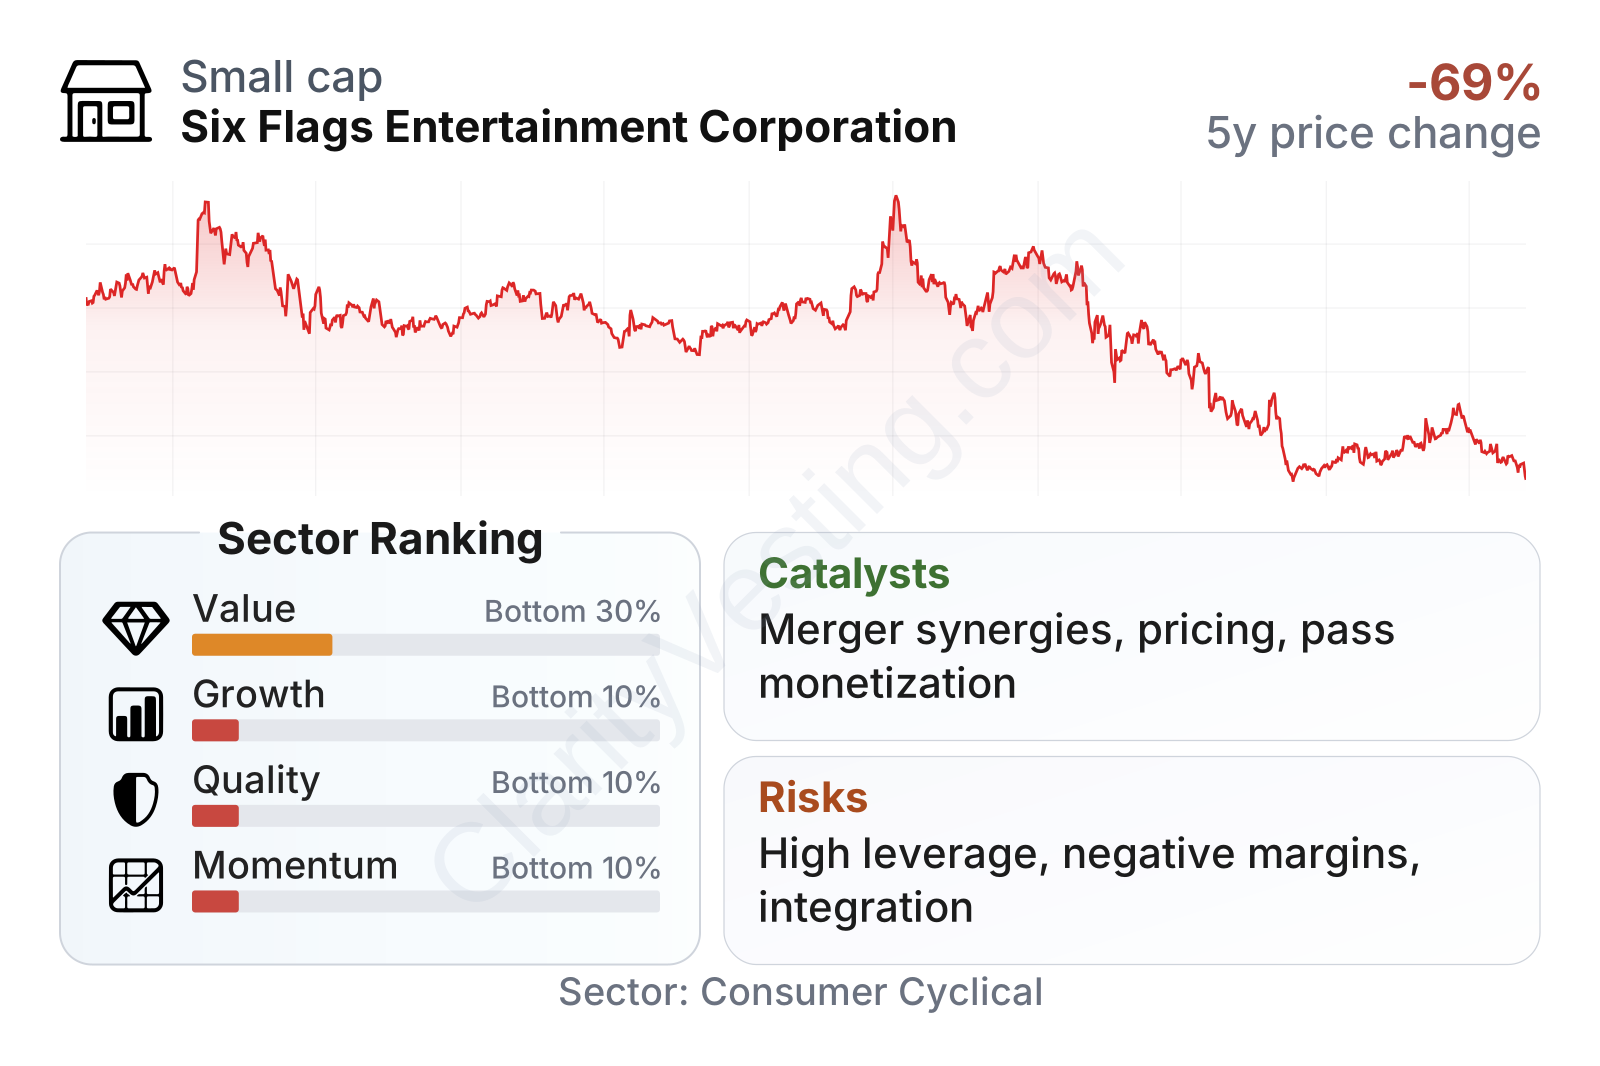
The market is currently treating Six Flags as a small-cap consumer discretionary company with a weak operating profile. Relative to the broader leisure sector, the company ranks poorly on growth, quality, and momentum, while value signals are mixed rather than clearly attractive. Free cash flow yield looks comparatively solid, but that is offset by negative profitability, weak returns on capital, and balance-sheet strain. The low beta suggests the stock’s recent moves have not closely tracked the wider market, yet company-specific factors have had a much stronger influence on performance.
Growth
Theme parks and out-of-home leisure remain structurally relevant categories. Families continue to spend on experiences, and regional parks can benefit from shorter travel times, lower total trip costs, and repeat local attendance. In that sense, Six Flags operates in a sector that is not disappearing. The real question is not whether people still want amusement parks, but whether the company can turn its enlarged asset base into steady, profitable growth.
The merger rationale is understandable. Combining Cedar Fair and Six Flags created one of the largest regional amusement park platforms in North America, with broader geographic reach, purchasing scale, richer customer data, and more opportunities to standardize pricing, marketing, technology, and capital allocation. Management has emphasized synergies from procurement, back-office integration, and revenue optimization. If execution improves, those levers could matter because this is a business where modest changes in attendance, pricing, or in-park spending can have an outsized impact on earnings.
Recent revenue growth has been volatile rather than consistently upward. There was a sharp jump around the merger period, but the latest year-over-year trend has weakened significantly. That makes headline expansion less convincing than it first appears. Long-term investors typically want to see whether the combined company can stabilize attendance trends and improve guest spending without relying mainly on one-time merger effects.
Cash generation also shows a mixed picture. Free cash flow was healthy earlier in the period, then turned negative, and more recently moved back into positive territory but at a much lower level. For a capital-intensive operator with significant debt and seasonal operations, this matters a great deal. A durable recovery in free cash flow would be one of the clearest signs that integration efforts are translating into real business improvement.
Recent company communications have pointed to integration planning, portfolio optimization, and cost synergies as major opportunities. The combined pass-holder base, broader park network, and ability to spread technology and marketing investments across more properties are plausible catalysts. Another opportunity is yield management: better pricing, premium products, and guest segmentation can increase revenue per guest without requiring dramatic attendance growth.
Risks
This article is for informational purposes only and does not constitute financial advice. Some content is AI-generated. See Disclaimer


